The GEI 2009
|
|
 |
||||
|
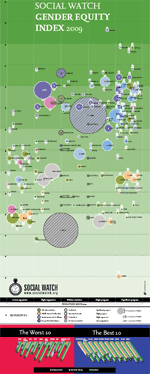
The Gender Equity Index 2009 computed by Social Watch shows that the gender gap is not narrowing in most countries and a majority of the countries that show progress are those that were already comparatively better. The distance between the countries and regions in the better and worse relative situations has widened in the last years. In education and economic activity the situation of women has globally improved, but when it comes to empowerment some 15% of countries have regressed over the past year, and this has been so severe that the average global value of this indicator fell from 35% in 2008 to 34.5% in 2009. |
|||||
| GEI regional average by component
|
|||||
| THE THREE GAPS | |||||
| GEI values in 2009 | |||||
| Attachment | Size |
|---|---|
| GEI2009_eng.pdf | 1.69 MB |
GEI REGIONAL AVERAGE BY COMPONENT
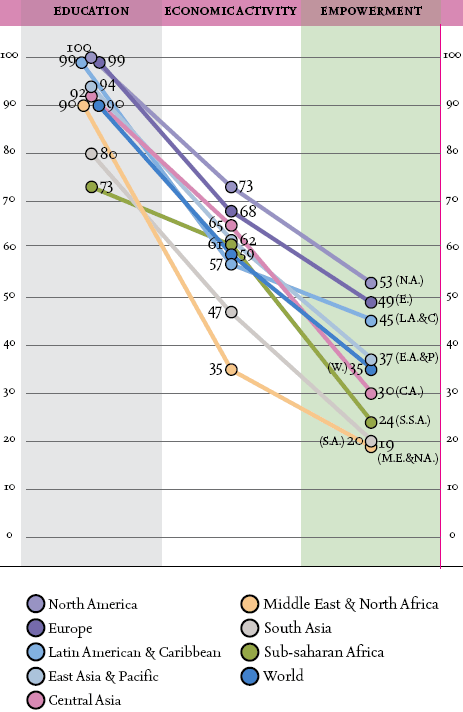 |
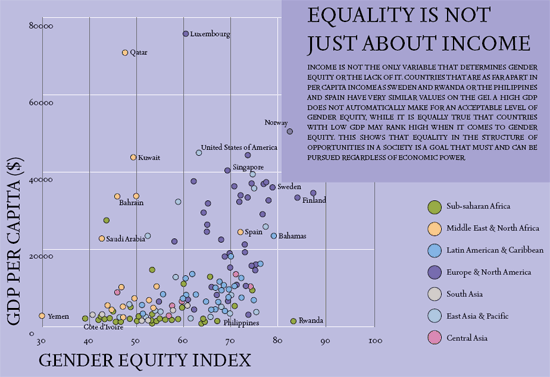
Better off does not mean more empowered, Women’s levels of empowerment do not depend on a country’s level of wealth; a high level of economic development does not necessarily lead to gender equity. In all the regions of the world, with the marked exception of North America, there are countries that are deficient in the empowerment dimension. Even in Europe there are countries in the worse relative and below average situations. There are also some countries that are classed by the World Bank as high income in which women are relatively deprived in terms of access to power, such as Japan (59 points) and the Czech Republic (53 points). Also, while the proportion of women in positions to make decisions and influence state policy may be increasing, and thus paving the way towards gender equity, there are still structural limitations, above all those of cultural origin, that may hamper, impede or even reverse progress in this area. |
|
GEI 2009
|
No progress there where it is needed the most |
Measuring inequity: the 2009 Gender Equity Index |
GEI regional average by component | THE THREE GAPS |
| Attachment | Size |
|---|---|
| GEI2009_RegionalAverage_eng.pdf | 467.01 KB |
GEI values in 2009
|
COUNTRY |
GEI 2009 |
EDUCATION |
ECONOMIC ACTIVITY |
EMPOWERMENT |
|
|
Sweden |
88 |
96.3 |
83.8 |
82.9 |
|
|
Finland |
84 |
98.6 |
78.5 |
75.7 |
|
|
Rwanda |
84 |
88.2 |
84.6 |
77.8 |
|
|
Norway |
83 |
96.2 |
82.0 |
69.8 |
|
|
Bahamas |
79 |
98.1 |
80.7 |
58.9 |
|
|
Denmark |
79 |
97.6 |
78.6 |
61.1 |
|
|
Germany |
78 |
93.8 |
67.6 |
73.0 |
|
|
Iceland |
78 |
98.7 |
78.8 |
55.2 |
|
|
New Zealand |
78 |
97.5 |
76.1 |
59.2 |
|
|
Netherlands |
77 |
95.7 |
70.7 |
65.4 |
|
|
Spain |
77 |
98.4 |
58.3 |
74.1 |
|
|
Barbados |
76 |
99.0 |
73.2 |
57.0 |
|
|
Philippines |
76 |
98.5 |
63.5 |
64.8 |
|
|
Lithuania |
76 |
97.3 |
75.6 |
53.8 |
|
|
Croatia |
75 |
99.4 |
70.7 |
56.0 |
|
|
Australia |
75 |
95.2 |
75.0 |
55.0 |
|
|
Latvia |
75 |
97.1 |
71.0 |
57.0 |
|
|
Colombia |
75 |
98.8 |
69.7 |
56.5 |
|
|
Hong Kong |
75 |
95.7 |
66.0 |
62.4 |
|
|
South Africa |
75 |
98.9 |
51.4 |
73.8 |
|
|
Canada |
74 |
95.9 |
73.8 |
53.7 |
|
|
Kazakhstan |
74 |
97.3 |
75.1 |
50.4 |
|
|
Viet Nam |
74 |
96.5 |
81.3 |
44.0 |
|
|
Moldova |
74 |
97.9 |
71.8 |
51.9 |
|
|
United States of America |
74 |
97.0 |
72.3 |
52.3 |
|
|
United Kingdom |
74 |
97.5 |
72.8 |
51.1 |
|
|
Bulgaria |
73 |
96.1 |
71.6 |
52.6 |
|
|
Estonia |
73 |
97.6 |
71.2 |
50.8 |
|
|
Portugal |
73 |
97.6 |
69.1 |
52.8 |
|
|
Ecuador |
72 |
98.5 |
64.3 |
54.3 |
|
|
Argentina |
72 |
98.8 |
61.9 |
56.2 |
|
|
Belgium |
72 |
96.0 |
64.2 |
56.2 |
|
|
Israel |
72 |
97.1 |
75.2 |
44.1 |
|
|
France |
72 |
96.6 |
71.7 |
47.8 |
|
|
Tanzania |
72 |
80.5 |
83.9 |
51.3 |
|
|
Romania |
71 |
97.3 |
74.6 |
42.0 |
|
|
Russia |
71 |
97.3 |
71.2 |
45.1 |
|
|
Namibia |
71 |
96.5 |
65.6 |
50.8 |
|
|
Austria |
71 |
95.1 |
61.0 |
56.6 |
|
|
St Lucia |
71 |
98.2 |
59.1 |
55.4 |
|
|
Thailand |
70 |
98.3 |
71.7 |
40.6 |
|
|
Cuba |
70 |
96.7 |
52.0 |
61.7 |
|
|
Trinidad and Tobago |
70 |
98.1 |
53.7 |
58.6 |
|
|
Mongolia |
70 |
99.4 |
58.2 |
52.6 |
|
|
Kyrgyzstan |
70 |
98.8 |
65.8 |
45.5 |
|
|
Poland |
70 |
96.2 |
68.8 |
45.2 |
|
|
Hungary |
70 |
96.1 |
68.3 |
44.9 |
|
|
Peru |
70 |
98.8 |
63.4 |
47.0 |
|
|
Panama |
70 |
98.1 |
60.8 |
50.4 |
|
|
Ukraine |
69 |
97.4 |
66.9 |
44.0 |
|
|
Ireland |
69 |
98.1 |
63.3 |
46.9 |
|
|
Honduras |
69 |
99.1 |
53.6 |
54.2 |
|
|
Slovakia |
69 |
97.0 |
67.2 |
42.2 |
|
|
Uruguay |
69 |
97.1 |
64.0 |
45.1 |
|
|
Brazil |
68 |
96.5 |
64.6 |
43.6 |
|
|
China |
68 |
92.4 |
73.3 |
38.6 |
|
|
Czech Republic |
68 |
96.8 |
64.0 |
43.4 |
|
|
Venezuela |
68 |
98.3 |
60.8 |
43.9 |
|
|
El Salvador |
68 |
99.1 |
51.2 |
52.3 |
|
|
Macedonia |
67 |
96.1 |
55.5 |
50.1 |
|
|
Uganda |
67 |
83.1 |
81.1 |
37.4 |
|
|
Costa Rica |
67 |
98.2 |
54.3 |
47.9 |
|
|
Paraguay |
67 |
97.6 |
55.6 |
47.2 |
|
|
Belarus |
66 |
96.6 |
72.7 |
28.9 |
|
|
Bolivia |
66 |
94.8 |
65.7 |
37.6 |
|
|
Botswana |
66 |
98.8 |
49.0 |
49.5 |
|
|
Timor-Leste |
66 |
95.1 |
67.0 |
34.9 |
|
|
Greece |
65 |
95.9 |
61.2 |
38.6 |
|
|
Slovenia |
65 |
81.8 |
70.7 |
42.8 |
|
|
Cyprus |
65 |
97.9 |
68.2 |
29.0 |
|
|
Dominican Republic |
65 |
97.5 |
49.9 |
47.1 |
|
|
Italy |
64 |
96.8 |
54.6 |
42.1 |
|
|
Mozambique |
64 |
67.6 |
91.5 |
34.2 |
|
|
Lesotho |
64 |
99.5 |
57.6 |
35.9 |
|
|
Burundi |
64 |
75.8 |
88.1 |
27.9 |
|
|
Singapore |
63 |
95.0 |
58.6 |
36.5 |
|
|
Belize |
63 |
98.2 |
45.9 |
44.1 |
|
|
Georgia |
62 |
94.7 |
49.7 |
42.5 |
|
|
Switzerland |
62 |
91.8 |
71.3 |
23.4 |
|
|
Chile |
62 |
97.1 |
45.9 |
42.8 |
|
|
Cambodia |
62 |
78.1 |
83.5 |
23.2 |
|
|
Maldives |
61 |
97.9 |
58.6 |
26.2 |
|
|
Bosnia and Herzegovina |
61 |
93.3 |
76.0 |
13.0 |
|
|
Jamaica |
61 |
99.0 |
64.7 |
18.3 |
|
|
Luxembourg |
61 |
98.2 |
60.1 |
23.5 |
|
|
Mexico |
61 |
98.8 |
44.3 |
38.5 |
|
|
Mauritius |
60 |
98.3 |
47.5 |
34.5 |
|
|
St Vincent and Grenadines |
60 |
96.6 |
59.5 |
23.6 |
|
|
Azerbaijan |
60 |
91.1 |
73.3 |
15.3 |
|
|
Guyana |
60 |
96.7 |
47.1 |
35.7 |
|
|
Angola |
60 |
75.3 |
71.3 |
32.8 |
|
|
Kenya |
59 |
85.3 |
80.6 |
11.2 |
|
|
Japan |
59 |
91.5 |
55.3 |
30.2 |
|
|
Malaysia |
58 |
98.6 |
46.6 |
29.7 |
|
|
Malta |
58 |
96.7 |
49.5 |
28.5 |
|
|
Sri Lanka |
58 |
98.0 |
43.0 |
32.4 |
|
|
Ghana |
58 |
79.4 |
82.5 |
11.0 |
|
|
Armenia |
58 |
97.1 |
71.2 |
4.6 |
|
|
Zimbabwe |
58 |
88.1 |
67.0 |
17.6 |
|
|
Uzbekistan |
57 |
89.7 |
68.9 |
12.5 |
|
|
Zambia |
56 |
79.0 |
64.0 |
25.6 |
|
|
Suriname |
56 |
97.5 |
46.1 |
23.8 |
|
|
Indonesia |
55 |
96.8 |
52.8 |
16.0 |
|
|
Albania |
55 |
96.3 |
61.9 |
6.6 |
|
|
Senegal |
55 |
76.4 |
61.3 |
27.1 |
|
|
Iran |
54 |
97.1 |
45.7 |
20.5 |
|
|
Burkina Faso |
54 |
68.8 |
76.6 |
17.7 |
|
|
Vanuatu |
54 |
76.0 |
79.5 |
6.5 |
|
|
Syria |
54 |
93.3 |
38.8 |
29.2 |
|
|
Cape Verde |
54 |
97.8 |
40.1 |
22.6 |
|
|
Gabon |
53 |
77.7 |
65.9 |
16.7 |
|
|
Ethiopia |
53 |
64.8 |
69.7 |
25.5 |
|
|
Mali |
53 |
65.5 |
77.3 |
17.0 |
|
|
Algeria |
53 |
96.5 |
39.4 |
22.4 |
|
|
Bangladesh |
53 |
85.8 |
53.5 |
18.9 |
|
|
Korea, Rep. |
53 |
80.0 |
53.9 |
23.6 |
|
|
Laos |
52 |
80.6 |
59.2 |
16.8 |
|
|
Tajikistan |
52 |
78.2 |
65.8 |
12.2 |
|
|
Nicaragua |
52 |
98.5 |
36.4 |
19.7 |
|
|
Guatemala |
51 |
93.7 |
36.7 |
23.5 |
|
|
Nepal |
51 |
74.1 |
57.1 |
22.5 |
|
|
Cameroon |
51 |
80.4 |
57.1 |
14.3 |
|
|
Mauritania |
51 |
75.0 |
57.3 |
19.2 |
|
|
Gambia |
50 |
72.5 |
60.8 |
17.7 |
|
|
United Arab Emirates |
50 |
97.3 |
33.4 |
19.2 |
|
|
Tunisia |
50 |
96.8 |
33.5 |
18.6 |
|
|
Kuwait |
49 |
97.6 |
46.3 |
4.2 |
|
|
Swaziland |
49 |
95.0 |
35.8 |
15.7 |
|
|
Samoa |
49 |
92.7 |
44.5 |
8.6 |
|
|
Sao Tomé and Principe |
49 |
98.3 |
35.2 |
12.3 |
|
|
Qatar |
48 |
98.0 |
32.7 |
12.2 |
|
|
Niger |
47 |
54.0 |
65.8 |
22.1 |
|
|
Jordan |
47 |
98.8 |
33.5 |
9.4 |
|
|
Djibouti |
47 |
74.5 |
56.2 |
10.8 |
|
|
Eritrea |
47 |
62.1 |
54.3 |
24.8 |
|
|
Lebanon |
47 |
98.4 |
36.2 |
6.2 |
|
|
Guinea-Bissau |
47 |
46.9 |
58.3 |
35.6 |
|
|
Solomon Islands |
47 |
82.4 |
58.2 |
0.0 |
|
|
Togo |
47 |
71.8 |
49.4 |
18.7 |
|
|
Turkey |
46 |
85.3 |
35.8 |
17.3 |
|
|
Bahrain |
46 |
98.0 |
34.1 |
6.0 |
|
|
Oman |
46 |
96.7 |
23.5 |
17.6 |
|
|
Central African Republic |
46 |
55.8 |
70.0 |
11.4 |
|
|
Congo, Rep. |
45 |
65.4 |
57.4 |
12.6 |
|
|
Morocco |
45 |
84.0 |
29.2 |
21.4 |
|
|
Sierra Leone |
45 |
65.9 |
52.8 |
15.1 |
|
|
Nigeria |
44 |
76.9 |
47.0 |
9.3 |
|
|
Egypt |
44 |
91.3 |
25.1 |
15.2 |
|
|
Equatorial Guinea |
44 |
73.8 |
49.4 |
7.9 |
|
|
Chad |
43 |
46.2 |
74.9 |
9.2 |
|
|
Pakistan |
43 |
75.9 |
34.2 |
18.0 |
|
|
Saudi Arabia |
43 |
96.4 |
18.9 |
12.8 |
|
|
Sudan |
43 |
86.4 |
29.1 |
12.4 |
|
|
Benin |
42 |
53.9 |
54.7 |
17.8 |
|
|
India |
41 |
77.5 |
36.6 |
7.9 |
|
|
Côte d'Ivoire |
39 |
64.5 |
38.1 |
15.2 |
|
|
Yemen |
30 |
49.2 |
34.4 |
6.3 |
|
| Attachment | Size |
|---|---|
| GEI2009-VALUES.pdf | 112.65 KB |
MEASURING INEQUITY: THE 2009 GENDER EQUITY INDEX
Social Watch developed the Gender Equity Index (GEI) to make the gender inequities more visible and to monitor the evolution in the different countries of the world. The GEI is based on information available that can be compared internationally, and it makes it possible to classify countries and rank them in accordance with a selection of gender inequity indicators in three dimensions, education, economic participation and empowerment.
In most societies men and women are assigned different responsibilities, rights, benefits and opportunities in the activities they perform, in access to control of resources and in decision-making processes.
In order to measure inequities we have established the proportions or ratio between the sexes in different indicators. This is used as a basis for inferring the structure of opportunities and so countries can be compared in an agile way that is direct and intuitive. What the GEI measures is the gap between women and men, not their well-being. For example, a country in which young men and women have equal access to a university education receives a value of 100 on this particular indicator, and a country in which boys and girls are equally barred from completing primary education would also be awarded a value of 100. This does not mean that the quality of education does not need to be improved; it just establishes that, in this case, girls education is not inferior than that of boys.
The way the GEI is calculated is a response to the need to reflect all situations that are unfavourable to women. When there is a situation in which women are at a proportional disadvantage with respect to men, the GEI does not reach its maximum value of 100 points. The final value on the index depends on the degree of negative inequity for women prevailing in a given country or region regardless of whether there may also be inequities that are positive for women (that is to say negative for men).
In 2009 some 156 countries were classified on the GEI using the most recent available values in the three dimensions of gender equity estimation. This is done by comparing their 2009 values with those for 2005. The number of countries considered in each of these three dimensions was not the same because of lack of available data, which is not homogenous among all countries. A country for which no data in available in one of the dimensions can be integrated into the partial analysis of the other dimensions.
|
GEI 2009
|
No progress there where it is needed the most |
Measuring inequity: the 2009 Gender Equity Index |
GEI regional average by component | THE THREE GAPS |
| Attachment | Size |
|---|---|
| GEI2009_MeasuringInequity_eng.pdf | 467.01 KB |
NO PROGRESS THERE WHERE IT IS NEEDED THE MOST
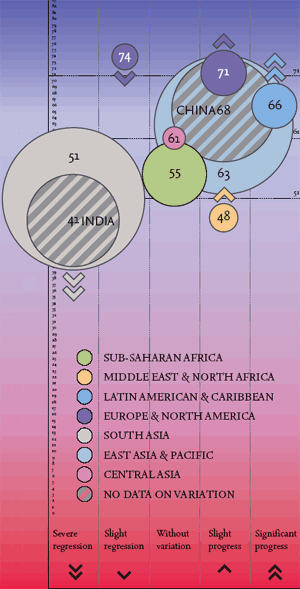 |
The Gender Equity Index 2009 computed by Social Watch shows that the gender gap is not narrowing in most countries and a majority of the countries that show progress are those that were already comparatively better. The distance between the countries and regions in the better and worse relative situations has widened in the last years. In education and economic activity the situation of women has globally improved, but when it comes to empowerment some 15% of countries have regressed over the past year, and this has been so severe that the average global value of this indicator fell from 35% in 2008 to 34.5% in 2009.
Sweden and Finland still have the highest values on the Gender Equity Index. Rwanda, which for years has figured among the most equitable countries in terms of gender, has moved up to third place, overtaking Germany and Norway and the Bahamas has risen from sixth to fifth.
The GEI makes it very clear that differences in income between countries are not directly correlated to gender inequity. Many poor countries have reached high levels of equity, even when the absolute situation of both women and men is one where too many live in poverty. On the other hand, in many countries that have acceptable average social indicators these satisfactory figures mask the fact that there are huge gaps between men and women.
A bad gender equity situation is associated with regression whereas a good starting situation favours progress: of the countries in the worse relative situation more than half (51.6%) regressed (slightly or severely), while more than half (77.1%) of those in a comparatively better situation made progress (slight or significant). This shows a structural and dynamic polarization in which, for the most part, the countries with higher equity index tend to evolve favourably, regardless of whether they are rich or poor or in what region they are located, while countries with higher levels of gender discrimination tend to get worse in this respect. In terms of regions, the paradigm examples of this polarization are Latin America and the Caribbean on the one hand and East Asia and the Pacific on the other.
|
GEI 2009
|
No progress there where it is needed the most |
Measuring inequity: the 2009 Gender Equity Index |
GEI regional average by component | THE THREE GAPS |
| Attachment | Size |
|---|---|
| GEI2009_NoProgress_eng.pdf | 467.02 KB |
THE THREE GAPS
THE GAP IN EDUCATION
We measure the gender gap in the following indicators:
• Literacy rate
• Enrolment rate in primary education
• Enrolment rate in secondary education
• Enrolment rate in tertiary education
source: unesco website database (www.uis.unesco.org), 2009.
Education is the sphere in which the gender equity gap has narrowed the most and in which more progress has been made. Yet, no country has reached the maximum value in this dimension.
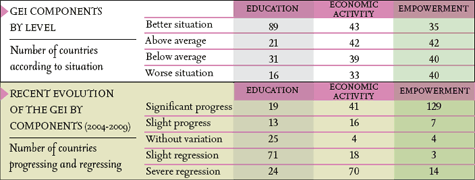
Some 83 (41%) of the 202 countries observed are in the better situation and another 60 (30%) are above average. However, of the 173 countries for which it was possible to evaluate recent evolution the relative situation has worsened in 80 and there has been severe regression in 29, so overall some 63% of countries have regressed and in just over 16% the situation has remained unchanged.
When we take a broad geographical perspective we find that the most problematic regions in absolute terms are Sub-Saharan Africa and South Asia where 80% of the countries are below the average. In relative terms the least equitable region, where gender polarization is more extreme in the education area, is South Asia, where there are no countries in the slightly favourable situation (i.e. somewhat above the average).
evolution of the GEI components. |
 |
THE GAP IN ECONOMIC ACTIVITY
The estimation of the gender gap in economic activity is based on the gender gap in the following indicators.
• Rate of economic activity
• Estimated perceived income
source: unesco website database (www.uis.unesco.org), 2009.
Of the 163 countries considered, 96 (59%) regressed slightly or severely and only 63 (39%) made progress. When we consider the proportion of countries that have progressed against the far higher proportion that have regressed it is evident that a process of geographic polarization is taking place, and the region worst affected is Sub-Saharan Africa.
In some countries women participate in the labour market less today than they did five years ago, and this is reflected in a relative decrease in women’s average income since 2004. On the other hand there are countries where women’s participation in the labour market (excluding agriculture) is growing, and this is paralleled by a relative increase in women’s income when compared to men’s. This is an equity gap that is wider or narrower in different regions.
THE EMPOWERMENT GAP
The estimation of empowerment is based on the following indicators:
• % of women in technical positions
• % of women in management and government positions
• % of women in parliament
• % of women in ministerial level positions
sources: unesco website database (www.uis.unesco.org), 2009. ipu database (www.ipu.org) , 2009.
Women continue to be under-represented in decision making. Even in the countries in the better relative situation women have still not achieved parity with men in empowerment.
In the countries in the worse relative situation there are two diverging trends. Since 2008 there has been a slight improvement in women’s participation in the professions, the legislature, and high official and management positions, but the values show that these countries are still a very long way from acceptable levels of equity. In the last two indicators on the list, the percentages of women in parliament and in ministerial positions, the average values among countries in the worse relative situation have fallen alarmingly since 2008 (from 8.3 to 5.4 and from 9.6 to 6, respectively).
 |
|---|
GEI
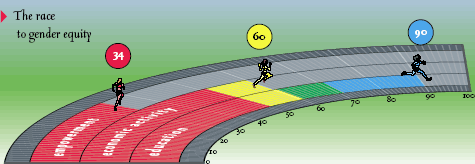
In the world as a whole the gender gap in education is far narrower than the gaps in the other gender equity dimensions. While progress has been made in empowerment – mainly in terms of women’s increased participation in politics – the overwhelming majority of countries in the world have not attained minimum acceptable levels because the starting points have been so low. As to economic participation, the overall situation has worsened since 2008 and a high percentage of countries have actually regressed.
EDUCATION. Education is the dimension in which the gender equity gap has shrunk most. The problems that remain to be overcome in education are less severe than in the empowerment and economic activity dimensions.
ECONOMIC ACTIVITY. The progress that was made in 2008 in gender equity in economic activity was all but wiped out in 2009.
EMPOWERMENT. It is in access to decision-making spaces and the exercise of power that inequity between men and women is most evident. In no country do women have the same opportunities as men to participate in economic and social decision-making processes. However, in the last 15 years promising progress has been made in equity of access to political power in the widest sense of the term.
 |
|
GEI 2009
|
No progress there where it is needed the most |
Measuring inequity: the 2009 Gender Equity Index |
GEI regional average by component | THE THREE GAPS |
| Attachment | Size |
|---|---|
| GEI2009_ThreeGaps_eng.pdf | 467.01 KB |