Measuring Inequity: The 2012 Gender Equity Index
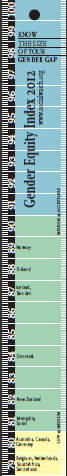 |
The Gender Equity Index (GEI) measures the gap between women and men in education, the economy and political empowerment. |
||||||||||
|
|||||||||||
|
Methodology I Download complete series of indicators (.xls version) |
|||||||||||
 |
|
 |
|
 |
|
||||||
|
Pdf version - arabic Pdf version - english Pdf version - español |
ECHOES IN THE PRESS | PRESS RELEASE COMUNICADO DE PRENSA COMMUNIQUÉ DE PRESSE |
||||||||
|
|
|||||||||||
Communiqué de presse
L’Indice d’Equité de Genre du Bénin est en dessous de la moyenne de l’Afrique sub-saharienne, ont déclaré les organisations de veille citoyenne au niveau mondial.
En matière d’équité de genre, le Bénin est très en dessous de la moyenne de l’Afrique subsaharienne, même si certains pays voisins occupent des rangs encore inférieurs avec des niveaux assez critiques d’Indice d’Equité de Genre (IEG).
C’est ce qui ressort de la publication de l'Indice de l'Equité de Genre (IEG) par Social Watch, à la veille de la Journée internationale de la femme de ce 8 Mars 2012.
L’IEG, élaboré chaque année par Social Watch, mesure le fossé entre les hommes et les femmes en ce qui concerne l’éducation, la participation économique et l’autonomisation politique. Cet Indice est une moyenne des inégalités dans ces trois dimensions. Dans le domaine de l’éducation, l’IEG mesure l’écart qui existe les hommes et les femmes au niveau du nombre d’inscriptions à tous les niveaux d’enseignement. En ce qui concerne la participation économique, il mesure la différence au niveau du revenu et de l’emploi. Quant à l’autonomisation politique, l’IEG mesure les différences en matière de présence d’hommes et femmes dans des emplois hautement qualifiés, dans des postes parlementaires et des postes de cadres supérieurs.
Social Watch mesure la disparité entre femmes et hommes, non leur bien-être. Ainsi par exemple, un pays où les jeunes hommes et femmes ont un égal accès à l’université recevra une note pondérée de 100 points dans cet indicateur précis ; de la même façon, un pays où les garçons et les filles ont une chance égale d’achever leur éducation primaire se verra aussi accorder la même note pondérée de 100. Ces 100 points ne signifient pas que la qualité de l’éducation dans ces deux pays est la même mais seulement que les filles n’y reçoivent pas moins d’éducation que les garçons.
Les 41 points obtenus par le Bénin le classent parmi les pays avec un très faible Indice d’Equité de Genre. L’IEG du Bénin est de 11 points inférieur à la moyenne de l’Afrique Sub-saharienne (52 points), et en dessous de celui de son voisin, le Burkina Faso (48). Mais la position du Bénin semble meilleure par rapport à ses voisins, le Togo (40) et le Niger (26) logé parmi les derniers pays du classement mondial.
Il est à faire remarquer que le Bénin est très loin derrière les pays qui sont en tête du classement mondial del’IEG 2012 comme la Norvège, la Finlande, l’Island, mais aussi très en- dessous de la Suède, du Danemark, la Nouvelle Zélande, l’Espagne et la Mongolie. Tous ces pays ont obtenu des indices au-dessus de 80 points qui les placent dans la catégorie des pays à "IEG MOYEN".
Les cinq niveaux d’appréciation sur la base desquels l’indice mesure les écarts en matière d’équité de genre sont : CRITIQUE, TRES FAIBLE, FAIBLE, MOYEN, et ACCEPTABLE.
Il est à noter qu’aucun pays n’a atteint 90 point ou plus ; ce qui signife qu’aucun pays dans le monde n’a atteint le niveau ACCEPTABLE en matière d’IEG.
Le Bénin est à un niveau TRES FAIBLE concernant l’indicateur Education (43), à un niveau CRITIQUE dans l’Autonomisation (14), et à un niveau TRES FAIBLE dans la Participation économique (66).
L’Afrique du Sud (79), le Rwanda (77) et la Namibie (77) sont les trois pays en tête dans la liste des pays d’Afrique sub-saharienne. Les trois pays de la région qui présentent des écarts énormes sont la République du Congo (29), le Niger (26) et le Tchad (25) qui sont aussi parmi les cinq pays de situation sur les 154 pays pris en compte par l’IEG 2012, suivis par le Yémen (24) et l’Afghanistan (15).
La Norvège, la Finlande et l’Island sont en tête du classement mondial avec 89, 88 et 87 point respectivement.
Les membres de Social Watch sont répandus dans toutes les régions du monde. C’est un Réseau qui lutte pour l’éradication de la pauvreté et de ses racines, pour l’elimination de toutes les formes de discrimination et de racisme, et qui veille à la distribution équitable des richesses et au respect des droits humains.
Pour plus de détails relatifs à la méthodologie et aux sources, voir
http://www.socialwatch.org/node/14365
Trouver ci-joint les 15 meilleurs et les 15 mauvais scores de l’IGE 2012.
|
15 MEILLEURS SCORES |
Education |
Autonomisation |
Participation économique |
IEG 2011 |
|
Norvège |
1,00 |
0,90 |
0,78 |
0,89 |
|
Finlande |
1,00 |
0,87 |
0,76 |
0,88 |
|
Island |
1,00 |
0,82 |
0,80 |
0,87 |
|
Suède |
0,99 |
0,85 |
0,77 |
0,87 |
|
Danemark |
1,00 |
0,87 |
0,66 |
0,84 |
|
Nouvelle Zélande |
1,00 |
0,83 |
0,63 |
0,82 |
|
Espagne |
0,99 |
0,71 |
0,73 |
0,81 |
|
Mongolie |
0,99 |
0,94 |
0,50 |
0,81 |
|
Canada |
1,00 |
0,83 |
0,57 |
0,80 |
|
Allemagne |
1,00 |
0,78 |
0,62 |
0,80 |
|
Australie |
1,00 |
0,83 |
0,57 |
0,80 |
|
Afrique du Sud |
0,98 |
0,74 |
0,66 |
0,79 |
|
Belgique |
0,98 |
0,79 |
0,61 |
0,79 |
|
Pays-Bas |
1,00 |
0,82 |
0,56 |
0,79 |
|
Suisse |
0,98 |
0,80 |
0,58 |
0,79 |
|
Trinité et Tobacco |
0,99 |
0,72 |
0,64 |
0,78 |
|
15 MAUVAIS SCORES |
Education |
Autonomisation |
Participation économique |
IEG 2011 |
|
Bénin |
0,43 |
0,66 |
0,14 |
0,41 |
|
Bhoutan |
0,72 |
0,41 |
0,09 |
0,41 |
|
Togo |
0,53 |
0,54 |
0,14 |
0,40 |
|
Soudan |
0,76 |
0,25 |
0,20 |
0,40 |
|
Maroc |
0,72 |
0,29 |
0,19 |
0,40 |
|
Arabie Saoudite |
0,93 |
0,04 |
0,15 |
0,37 |
|
Inde |
0,66 |
0,33 |
0,12 |
0,37 |
|
Congo Démocratique |
0,40 |
0,55 |
0,12 |
0,36 |
|
Mali |
0,35 |
0,42 |
0,19 |
0,32 |
|
Côte d’Ivoire |
0,42 |
0,41 |
0,12 |
0,32 |
|
Pakistan |
0,55 |
0,19 |
0,14 |
0,29 |
|
Congo |
0,34 |
0,40 |
0,12 |
0,29 |
|
Niger |
0,21 |
0,38 |
0,18 |
0,26 |
|
Tchad |
0,13 |
0,52 |
0,12 |
0,25 |
|
Yémen |
0,30 |
0,40 |
0,02 |
0,24 |
|
Afghanistan |
0,04 |
0,17 |
0,25 |
0,15 |
Comparing GEI with other Gender Measures
 |
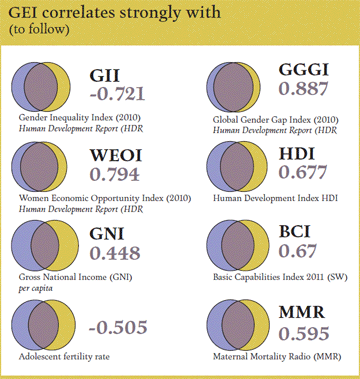
there are other indices that measure the gender gap using different indicators and parameters. The Gender Inequality Index or GII, for example, includes education, parliamentary representation, labor force participation and reproductive health indicators such as maternal mortality, adolescents’ fertility and contraceptive use.
The World Economic Forum developed its own indicator, the GlobalGender Gap Index (GGGI). which measures four social areas: economic participation and opportunity, educational attainment, general health and political empowerment. The Economist Intelligence Unit launched the Women’s Economic Opportunity Index (WEOI) in 2010, covering five dimensions: labour policy and practice, women’s economic opportunity, access to finance, education and training, women’s legal and social status, and general business environment.
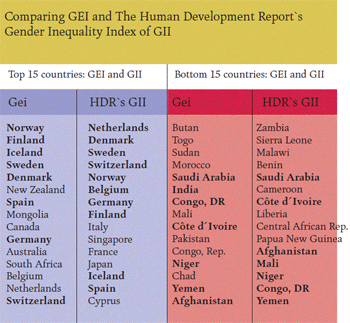
Although indices present their distinct emphasis and perspectives in measuring the gender gap, there are similarities as well. A comparison of the top and bottom 15 countries of the Social Watch GEI and the UNDP’s GII shows that 9 countries –Norway, Netherlands, Finland, Denmark, Iceland, Sweden, Switzerland, Germany and Spain– are common in the list of top performers, while 6 –Saudi Arabia, India, Congo DR, Côte d’Ivoire, Niger, Yemen and Afghanistan– are common in the list of bottom performers.
 |
Education, empowerment and economic activity by region
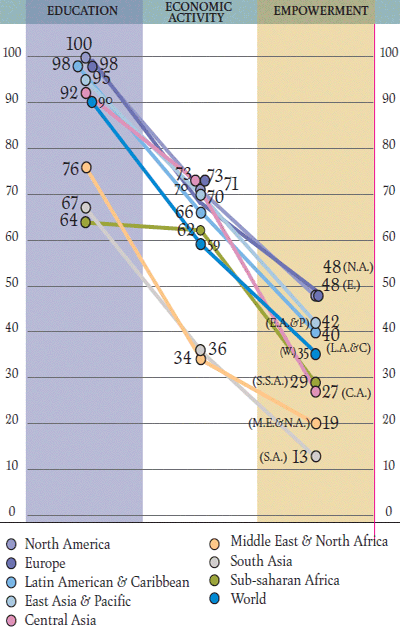 |
South Asia and the Middle East and North Africa register the lowest indices in empowerment (13 and 19, respectively), indicating the low status of women and the lack of affirmative action to address the gender gap in these countries. Both regions, likewise, score the lowest in economic participation. Central Asia also scored low in empowerment (27) even as countries in this region are relatively doing well in women’s economic participation. Sub-Saharan Africa scored a little higher at 29 in the empowerment dimension which corresponds to the global average. Europe and North America register the best performance in the empowerment dimension with the index at 73. Following closely are East Asia and Pacific (70) and Latin America and the Caribbean (66).
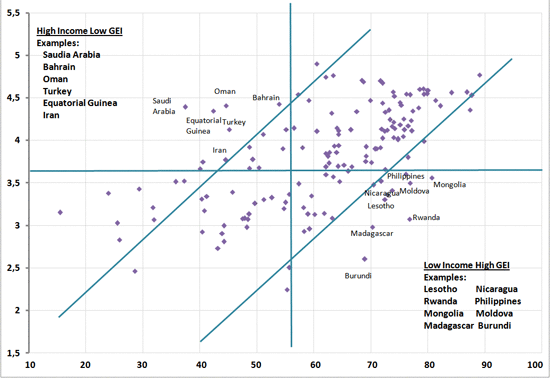
GEI and Per Capita Income
Differences in income between countries are not directly correlated to gender inequity. Countries such as Rwanda, Nicaragua, Bahamas and Philippines have reached high levels of equity, even when many women and men live in poverty. On the other hand, in countries that have acceptable average social indicators, such as Japan, Turkey and Saudi Arabia, these satisfactory figures mask the fact that there are huge gaps between men and women. This shows that equality in the structure of opportunities in a society is a goal that must and can be pursued regardless of economic power.
 |
GEI by country
| Country (alphabetical) | |||||||
| Education | Economic Activity | Women Empower-ment | GEI 2012 FINAL | RANKING | GEI 2012 FINAL | ||
| Afghanistan | 0,04 | 0,17 | 0,25 | 0,15 | Norway | 0,89 | |
| Albania | 0,94 | 0,57 | 0,13 | 0,55 | Finland | 0,88 | |
| Algeria | 0,86 | 0,44 | 0,16 | 0,49 | Iceland | 0,87 | |
| Angola | 0,70 | 0,73 | 0,50 | 0,64 | Sweden | 0,87 | |
| Argentina | 1,00 | 0,68 | 0,53 | 0,74 | Denmark | 0,84 | |
| Armenia | 1,00 | 0,74 | 0,36 | 0,70 | New Zealand | 0,82 | |
| Australia | 1,00 | 0,83 | 0,57 | 0,80 | Spain | 0,81 | |
| Austria | 1,00 | 0,68 | 0,54 | 0,74 | Mongolia | 0,81 | |
| Azerbaijan | 0,98 | 0,64 | 0,32 | 0,64 | Canada | 0,80 | |
| Bahamas | 1,00 | 0,34 | Germany | 0,80 | |||
| Bahrain | 0,97 | 0,35 | 0,30 | 0,54 | Australia | 0,80 | |
| Bangladesh | 0,81 | 0,65 | 0,18 | 0,55 | South Africa | 0,79 | |
| Belarus | 1,00 | 0,71 | 0,22 | 0,64 | Belgium | 0,79 | |
| Belgium | 0,98 | 0,79 | 0,61 | 0,79 | Netherlands | 0,79 | |
| Belize | 1,00 | 0,62 | 0,46 | 0,69 | Switzerland | 0,79 | |
| Benin | 0,43 | 0,66 | 0,14 | 0,41 | Trinidad and Tobago | 0,78 | |
| Bhutan | 0,72 | 0,41 | 0,09 | 0,41 | Portugal | 0,77 | |
| Bolivia | 0,92 | 0,64 | 0,43 | 0,66 | Latvia | 0,77 | |
| Bosnia and Herzegovina | 0,98 | 0,68 | 0,09 | 0,58 | Estonia | 0,77 | |
| Botswana | 1,00 | 0,78 | 0,41 | 0,73 | France | 0,77 | |
| Brazil | 0,98 | 0,75 | 0,43 | 0,72 | Moldova | 0,77 | |
| Brunei Darussalam | 0,99 | 0,78 | 0,39 | 0,72 | Rwanda | 0,77 | |
| Bulgaria | 0,99 | 0,81 | 0,47 | 0,76 | Lithuania | 0,77 | |
| Burkina Faso | 0,48 | 0,75 | 0,20 | 0,48 | Namibia | 0,77 | |
| Burundi | 0,69 | 0,91 | 0,47 | 0,69 | United Kingdom | 0,76 | |
| Cambodia | 0,71 | 0,73 | 0,21 | 0,55 | Philippines | 0,76 | |
| Cameroon | 0,65 | 0,44 | 0,15 | 0,41 | Panama | 0,76 | |
| Canada | 1,00 | 0,83 | 0,57 | 0,80 | Poland | 0,76 | |
| Cape Verde | 0,91 | 0,62 | 0,62 | 0,72 | Bulgaria | 0,76 | |
| Central African Republic | 0,26 | 0,69 | Slovenia | 0,75 | |||
| Chad | 0,13 | 0,52 | 0,12 | 0,25 | Russian Federation | 0,75 | |
| Chile | 0,99 | 0,60 | 0,56 | 0,72 | Israel | 0,75 | |
| China | 0,95 | 0,76 | 0,21 | 0,64 | Kazakhstan | 0,75 | |
| Colombia | 0,99 | 0,71 | 0,21 | 0,64 | Serbia | 0,75 | |
| Comoros | 0,74 | 0,70 | 0,01 | 0,48 | Uruguay | 0,74 | |
| Congo, DR | 0,40 | 0,55 | 0,12 | 0,36 | Ireland | 0,74 | |
| Congo, Rep. | 0,34 | 0,40 | 0,12 | 0,29 | Croatia | 0,74 | |
| Costa Rica | 1,00 | 0,61 | 0,60 | 0,74 | Costa Rica | 0,74 | |
| Côte d'Ivoire | 0,42 | 0,41 | 0,12 | 0,32 | Austria | 0,74 | |
| Croatia | 0,99 | 0,79 | 0,44 | 0,74 | Nicaragua | 0,74 | |
| Cuba | 1,00 | 0,48 | 0,56 | 0,68 | Argentina | 0,74 | |
| Cyprus | 0,95 | 0,76 | 0,32 | 0,68 | Hungary | 0,73 | |
| Czech Republic | 1,00 | 0,74 | 0,46 | 0,73 | Czech Republic | 0,73 | |
| Denmark | 1,00 | 0,87 | 0,66 | 0,84 | Kyrgyzstan | 0,73 | |
| Djibouti | 0,59 | 0,64 | 0,14 | 0,46 | Botswana | 0,73 | |
| Dominica | 1,00 | 0,60 | Slovakia | 0,73 | |||
| Dominican Republic | 1,00 | 0,71 | 0,44 | 0,72 | Paraguay | 0,73 | |
| Ecuador | 0,97 | 0,57 | 0,58 | 0,71 | Lesotho | 0,72 | |
| Egypt | 0,83 | 0,29 | 0,22 | 0,45 | Romania | 0,72 | |
| El Salvador | 0,98 | 0,55 | 0,34 | 0,62 | United States of America | 0,72 | |
| Equatorial Guinea | 0,92 | 0,28 | 0,07 | 0,42 | Brazil | 0,72 | |
| Eritrea | 0,45 | 0,58 | 0,30 | 0,44 | Greece | 0,72 | |
| Estonia | 0,99 | 0,80 | 0,52 | 0,77 | Chile | 0,72 | |
| Ethiopia | 0,37 | 0,71 | 0,25 | 0,44 | Cape Verde | 0,72 | |
| Finland | 1,00 | 0,87 | 0,76 | 0,88 | Brunei Darussalam | 0,72 | |
| France | 1,00 | 0,79 | 0,51 | 0,77 | Dominican Republic | 0,72 | |
| Gabon | 0,92 | 0,67 | 0,23 | 0,61 | Thailand | 0,71 | |
| Gambia | 0,79 | 0,71 | 0,26 | 0,59 | Ecuador | 0,71 | |
| Georgia | 0,98 | 0,63 | 0,39 | 0,67 | Viet Nam | 0,70 | |
| Germany | 1,00 | 0,78 | 0,62 | 0,80 | Madagascar | 0,70 | |
| Ghana | 0,79 | 0,88 | 0,19 | 0,62 | Armenia | 0,70 | |
| Greece | 0,99 | 0,68 | 0,49 | 0,72 | Italy | 0,70 | |
| Guatemala | 0,89 | 0,50 | 0,06 | 0,49 | Peru | 0,69 | |
| Guinea | 0,34 | 0,78 | Ukraine | 0,69 | |||
| Guinea-Bissau | 0,57 | 0,52 | 0,20 | 0,43 | Belize | 0,69 | |
| Guyana | 0,98 | 0,39 | 0,57 | 0,64 | Burundi | 0,69 | |
| Haiti | 0,84 | 0,45 | 0,16 | 0,48 | Singapore | 0,69 | |
| Honduras | 1,00 | 0,52 | 0,39 | 0,63 | Luxembourg | 0,68 | |
| Hungary | 0,98 | 0,82 | 0,40 | 0,73 | Cuba | 0,68 | |
| Iceland | 1,00 | 0,82 | 0,80 | 0,87 | Cyprus | 0,68 | |
| India | 0,66 | 0,33 | 0,12 | 0,37 | Georgia | 0,67 | |
| Indonesia | 0,93 | 0,57 | 0,36 | 0,62 | Mauritius | 0,67 | |
| Iran | 0,95 | 0,42 | 0,16 | 0,51 | Bolivia | 0,66 | |
| Iraq | 0,61 | 0,23 | Swaziland | 0,65 | |||
| Ireland | 1,00 | 0,74 | 0,48 | 0,74 | Guyana | 0,64 | |
| Israel | 1,00 | 0,81 | 0,44 | 0,75 | Azerbaijan | 0,64 | |
| Italy | 0,99 | 0,66 | 0,45 | 0,70 | Venezuela | 0,64 | |
| Jamaica | 0,97 | 0,75 | 0,16 | 0,63 | Belarus | 0,64 | |
| Japan | 0,93 | 0,65 | 0,14 | 0,57 | Angola | 0,64 | |
| Jordan | 0,97 | 0,39 | 0,11 | 0,49 | Mexico | 0,64 | |
| Kazakhstan | 0,99 | 0,82 | 0,44 | 0,75 | China | 0,64 | |
| Kenya | 0,86 | 0,75 | 0,14 | 0,58 | Colombia | 0,64 | |
| Kiribati | 0,96 | 0,06 | United Arab Emirates | 0,63 | |||
| Korea, DPR | Honduras | 0,63 | |||||
| Korea, Rep. | 0,84 | 0,68 | 0,26 | 0,59 | Uganda | 0,63 | |
| Kuwait | 0,97 | 0,57 | 0,33 | 0,62 | Malta | 0,63 | |
| Kyrgyzstan | 0,99 | 0,71 | 0,48 | 0,73 | Jamaica | 0,63 | |
| Lao, PDR | 0,75 | 0,69 | 0,23 | 0,56 | Maldives | 0,63 | |
| Latvia | 1,00 | 0,81 | 0,51 | 0,77 | El Salvador | 0,62 | |
| Lebanon | 0,95 | 0,42 | 0,28 | 0,55 | Sri Lanka | 0,62 | |
| Lesotho | 1,00 | 0,83 | 0,34 | 0,72 | Indonesia | 0,62 | |
| Liberia | 0,86 | 0,52 | 0,29 | 0,56 | Turkmenistan | 0,62 | |
| Libya | Kuwait | 0,62 | |||||
| Lithuania | 0,98 | 0,83 | 0,48 | 0,77 | Ghana | 0,62 | |
| Luxembourg | 1,00 | 0,75 | 0,30 | 0,68 | Gabon | 0,61 | |
| Madagascar | 0,94 | 0,84 | 0,33 | 0,70 | Qatar | 0,60 | |
| Malawi | 0,89 | 0,57 | 0,32 | 0,59 | Tanzania | 0,60 | |
| Malaysia | 0,98 | 0,40 | 0,31 | 0,56 | Papua New Guinea | 0,60 | |
| Maldives | 0,97 | 0,60 | 0,31 | 0,63 | Malawi | 0,59 | |
| Mali | 0,35 | 0,42 | 0,19 | 0,32 | Korea, Rep. | 0,59 | |
| Malta | 1,00 | 0,58 | 0,31 | 0,63 | Gambia | 0,59 | |
| Mauritania | 0,69 | 0,61 | 0,28 | 0,53 | Guatemala | 0,59 | |
| Mauritius | 0,98 | 0,59 | 0,42 | 0,67 | Mozambique | 0,58 | |
| Mexico | 0,98 | 0,56 | 0,37 | 0,64 | Kenya | 0,58 | |
| Moldova | 0,98 | 0,87 | 0,45 | 0,77 | Bosnia and Herzegovina | 0,58 | |
| Mongolia | 0,99 | 0,94 | 0,50 | 0,81 | Uzbekistan | 0,57 | |
| Montenegro | Japan | 0,57 | |||||
| Morocco | 0,72 | 0,29 | 0,19 | 0,40 | Malaysia | 0,56 | |
| Mozambique | 0,59 | 0,68 | 0,48 | 0,58 | Liberia | 0,56 | |
| Myanmar | 0,97 | 0,65 | Lao, PDR | 0,56 | |||
| Namibia | 1,00 | 0,76 | 0,54 | 0,77 | Zimbabwe | 0,55 | |
| Nepal | 0,65 | 0,56 | 0,21 | 0,47 | Lebanon | 0,55 | |
| Netherlands | 1,00 | 0,82 | 0,56 | 0,79 | Cambodia | 0,55 | |
| New Zealand | 1,00 | 0,83 | 0,63 | 0,82 | Bangladesh | 0,55 | |
| Nicaragua | 1,00 | 0,58 | 0,64 | 0,74 | Albania | 0,55 | |
| Niger | 0,21 | 0,38 | 0,18 | 0,26 | Bahrain | 0,54 | |
| Nigeria | 0,60 | 0,38 | Mauritania | 0,53 | |||
| Norway | 1,00 | 0,90 | 0,78 | 0,89 | Tajikistan | 0,51 | |
| Oman | 0,94 | 0,13 | 0,27 | 0,45 | Iran | 0,51 | |
| Pakistan | 0,55 | 0,19 | 0,14 | 0,29 | Syria | 0,50 | |
| Panama | 0,99 | 0,69 | 0,60 | 0,76 | Senegal | 0,50 | |
| Papua New Guinea | 0,89 | 0,88 | 0,02 | 0,60 | Jordan | 0,49 | |
| Paraguay | 0,99 | 0,70 | 0,49 | 0,73 | Algeria | 0,49 | |
| Peru | 0,96 | 0,69 | 0,43 | 0,69 | Zambia | 0,49 | |
| Philippines | 1,00 | 0,67 | 0,61 | 0,76 | Comoros | 0,48 | |
| Poland | 1,00 | 0,75 | 0,52 | 0,76 | Haiti | 0,48 | |
| Portugal | 0,99 | 0,78 | 0,55 | 0,77 | Burkina Faso | 0,48 | |
| Qatar | 0,98 | 0,53 | 0,30 | 0,60 | Nepal | 0,47 | |
| Romania | 0,99 | 0,80 | 0,39 | 0,72 | Djibouti | 0,46 | |
| Russian Federation | 1,00 | 0,81 | 0,44 | 0,75 | Turkey | 0,45 | |
| Rwanda | 0,84 | 0,72 | 0,74 | 0,77 | Oman | 0,45 | |
| Saudi Arabia | 0,93 | 0,04 | 0,15 | 0,37 | Egypt | 0,45 | |
| Senegal | 0,63 | 0,57 | 0,28 | 0,50 | Ethiopia | 0,44 | |
| Serbia | 0,98 | 0,75 | 0,51 | 0,75 | Eritrea | 0,44 | |
| Sierra Leone | 0,33 | 0,87 | 0,11 | 0,44 | Sierra Leone | 0,44 | |
| Singapore | 0,94 | 0,71 | 0,40 | 0,69 | Guinea-Bissau | 0,43 | |
| Slovakia | 1,00 | 0,75 | 0,43 | 0,73 | Equatorial Guinea | 0,42 | |
| Slovenia | 1,00 | 0,79 | 0,47 | 0,75 | Cameroon | 0,41 | |
| Somalia | Benin | 0,41 | |||||
| South Africa | 0,98 | 0,74 | 0,66 | 0,79 | Bhutan | 0,41 | |
| Spain | 0,99 | 0,71 | 0,73 | 0,81 | Togo | 0,40 | |
| Sri Lanka | 0,97 | 0,58 | 0,31 | 0,62 | Sudan | 0,40 | |
| Sudan | 0,76 | 0,25 | 0,20 | 0,40 | Morocco | 0,40 | |
| Suriname | 0,98 | 0,62 | .. | Saudi Arabia | 0,37 | ||
| Swaziland | 0,93 | 0,73 | 0,31 | 0,65 | India | 0,37 | |
| Sweden | 0,99 | 0,85 | 0,77 | 0,87 | Congo, DR | 0,36 | |
| Switzerland | 0,98 | 0,80 | 0,58 | 0,79 | Mali | 0,32 | |
| Syria | 0,89 | 0,38 | 0,24 | 0,50 | Côte d'Ivoire | 0,32 | |
| Tajikistan | 0,74 | 0,67 | 0,13 | 0,51 | Pakistan | 0,29 | |
| Tanzania | 0,71 | 0,68 | 0,42 | 0,60 | Congo, Rep. | 0,29 | |
| Thailand | 0,97 | 0,77 | 0,39 | 0,71 | Niger | 0,26 | |
| Togo | 0,53 | 0,54 | 0,14 | 0,40 | Chad | 0,25 | |
| Trinidad and Tobago | 0,99 | 0,72 | 0,64 | 0,78 | Yemen | 0,24 | |
| Tunisia | 0,93 | 0,18 | Afghanistan | 0,15 | |||
| Turkey | 0,83 | 0,34 | 0,19 | 0,45 | Bahamas | ||
| Turkmenistan | 1,00 | 0,73 | 0,13 | 0,62 | Central African Republic | ||
| Uganda | 0,82 | 0,59 | 0,48 | 0,63 | Dominica | ||
| Ukraine | 1,00 | 0,67 | 0,41 | 0,69 | Guinea | ||
| United Arab Emirates | 0,98 | 0,49 | 0,43 | 0,63 | Iraq | ||
| United Kingdom | 1,00 | 0,81 | 0,47 | 0,76 | Kiribati | ||
| United States of America | 1,00 | 0,69 | 0,47 | 0,72 | Korea, DPR | ||
| Uruguay | 1,00 | 0,72 | 0,51 | 0,74 | Libya | ||
| Uzbekistan | 0,87 | 0,71 | 0,13 | 0,57 | Montenegro | ||
| Venezuela | 1,00 | 0,65 | 0,28 | 0,64 | Myanmar | ||
| Viet Nam | 0,95 | 0,75 | 0,41 | 0,70 | Nigeria | ||
| Yemen | 0,30 | 0,40 | 0,02 | 0,24 | Somalia | ||
| Zambia | 0,78 | 0,49 | 0,18 | 0,49 | Suriname | ||
| Zimbabwe | 0,88 | 0,57 | 0,21 | 0,55 | Tunisia | ||
Download GEI 2012 by country (.ods version)
Measuring Inequity: The 2012 Gender Equity Index
The Gender Equity Index (GEI) measures the gap between women and men in education, the economy and political empowerment.
Social Watch computes a value for the gender gap in each of the three areas in a scale from 0 (when for example no women is educated at all and all men are) to 100 (perfect equality). The GEI, in turn, is the simple average of the three dimensions. In Education, GEI looks at the gender gap in enrolment at all levels and in literacy; economic participation computes the gaps in income and employment and empowerment measures the gaps in highly qualified jobs, parliament and senior executive positions.
Measuring the gap
The GEI measures the gap between women and men, not their well-being. Thus, a country in which young men and women have equal access to the university receives a value of 100 on this particular indicator. In the same fashion, a country in which boys and girls are equally barred from completing primary education would also be awarded a value of 100. This does not mean that the quality of education in both cases is the same. It just establishes that, in both cases girls are not less educated than boys.
BIG STEPS AHEAD
 |
||||||
|
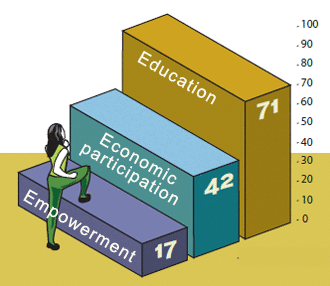
Overall in the world, the gender gap in education is narrower than that in the other two components. While the world value for education is 71 (or LOW, according to GEI categories), that for economic participation is 42 (VERY LOW) while women participation in decision making reaches a meagre 17 (CRITICAL).
Women’s participation in the labor force is significantly less compared to men. They have substantially lower salaries for the same type of work and a higher percentage of women are employed in vulnerable or irregular jobs. But more importantly, in no country do women have the same opportunities as men to participate in economic and social decision-making processes. Women still take the back seat even if they have achieved significant strides in education and economic participation.
Even in those countries where the relative situation of women is better, the gender gap in empowerment remains substantial.
Methodology
MEASURING INEQUITY:
THE 2012 GENDER INEQUITY INDEX
The Gender Equity Index (GEI) is a composite index composed of the eleven indicators representing three dimensions that measure the gap between women and men in key social areas of education, empowerment and economic participation. An index is generated for each of these dimensions based on the values of the component indicators.
The ratio of female to male performance for each of the eleven indicators is computed and rescaled to generate a value ranging from 0 (corresponding to the lowest ratio) to 100 (corresponding to the highest ratio). The values are rescaled to standardize the range of the component indicators and, thus, eliminate discrepancies in computation process if one or two of the indicators are missing or not available. The indicators are also weighted according to population to account for disparities in the population share of women and men in a particular country and, thus, produce a more accurate measure of the size of the gap in social participation between women and men. Since most countries have a greater number of women than men in their population, this weighting procedure is important in order not to under-represent the gap.
An index for each of the three dimensions (Education Index, Empowerment Index and Economic Index) is generated by computing the simple average of the rescales values of the component indicators. The GEI, in turn, is generated by computing the simple average of the three indices representing the three dimensions.
As a rule, the index for a particular dimension is generated if there are at least two indicators with available data (out of the three or four indicators). Otherwise, the index for the particular dimension is not computed, therefore, no GEI value is generated for the particular country.
Press release - The Gender Equity Index 2012
All over the world women have little access to the economy and decision making, says watchdog organization
The achievements made by women all over the world towards equity in education are still very far from having an impact on their having a fair share in the economy or in political power. This can be concluded from the updated figures of the Gender Equity Index (GEI) 2012, published by Social Watch on the eve of Women’s International Day, March 8.
The index prepared annually by Social Watch measures the gap between women and men in education, the economy and political empowerment. The index is an average of the inequalities in the three dimensions. In literacy, it examines the gender gap in enrolment at all levels; economic participation computes the gaps in income and employment; empowerment measures the gaps in highly qualified jobs, parliament and senior executive positions.
The GEI 2012 has computed a world value for education of 71 (or LOW, according to the index categories), while for economic participation computed 42 (VERY LOW) and for political empowerment a meagre 17 (CRITICAL.
Women’s participation in the labor force is significantly less compared to men. They have substantially lower salaries for the same type of work and a higher percentage of women are employed in vulnerable or irregular jobs. But more importantly, as the index shows, the underachievement in economic participation and empowerment for women is verified in each of the 154 countries studied in the 2012 issue of the index.
Social Watch measures the gap between women and men, not their wellbeing. Thus, a country in which young men and women have equal access to the university receives a value of 100 on this particular indicator. in the same fashion, a country in which boys and girls are equally barred from completing primary education would also be awarded a value of 100. This does not mean that the quality of education in both cases is the same. It just establishes that, in both cases girls are not less educated than boys.
Through this procedure, the GEI 2012 makes also clear that the lack of equity cannot be justified by a lack of resources: the GEI mapping and that of each of its components show that, regardless of income levels, each country can reduce gender disparity through adequate policies.
Countries such as Mongolia (81), Rwanda (77), The Philippines (76) and Nicaragua (74) have reached high levels of gender equity, even when many women and men live in poverty. On the other hand, countries with an elevated income, such as Japan (57 GEI points), Turkey and Saudi Arabia (37 GEI points) present huge gaps between men and women. The GEI 2012 stresses that these figures show that equality in the structure of opportunities in a society is a goal that must and can be pursued regardless of economic power.
The five levels according to which the index measures the gender gap are: CRITICAL, VERY LOW, LOW, MEDIUM AND ACCEPTABLE. No country in the world has reached 90 points or more, meaning that no country has yet reached the ACCEPTABLE level.
When considering the gender gap in terms of regions, the re index finds that Europe and North America, bot with an average GEI computed at 73 (LOW) are heading the chart. The index stresses, however, that not all of the European countries are doing well in closing their gender gap. Albania (55) and Turkey (45), for example, score below the global average, which is 57 (VERY LOW).
The East Asia and Pacific with 69, Latin America and the Caribbean (68) and Central Asia (63) are also in the LOW category. Sub-Saharan Africa (52) and the Middle East and North Africa with (43) are both in the VERY LOW category, and both below the global average, while South Asia is at the very bottom of the chart with 39 points (CRITICAL).
Out of the 154 countries computed, those achieving a better score are Norway (89), Finland (88) Iceland, Sweeden (87), Denmark (84), New Zealand (82), and Mongolia and Spain (81), all of them with a MEDIUM GEI.
The five counties in the worst global situation are Congo Rep (29), Niger (26), Tchad (25), Yemen (24) and Afghanistan (15), all of the with CRITICAL GEI.
Social Watch members are spread across all regions. The network fights for the eradication of poverty and its causes, the elimination of all forms of discrimination and racism and to ensure an equitable distribution of wealth and the realization of human rights.
For a detailed description of methodology and sources see http://www.socialwatch.org/node/14365