BCI Trends by Component Indicators
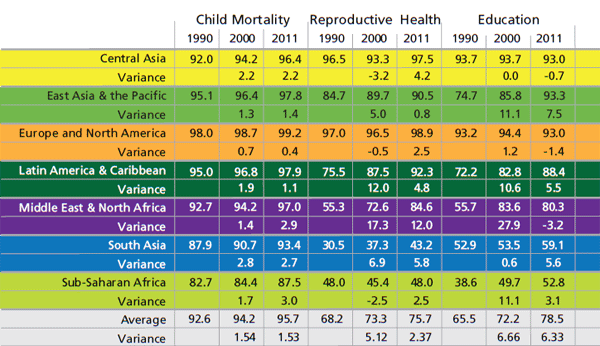
The child mortality index has the highest values across countries and regions. The reproductive health index and education index have similar values which are significantly lower compared to the child mortality index. Globally, the 2011 population weighted average value of the child mortality index is computed at 95.7. In comparison, the corresponding value for education is 78.5 and 75.7 for the reproductive health. That means more efforts are needed to address the gaps and significantly improve education and reproductive health.
Table belows shows the average values of the component indicators for years 1990, 2000 and 2011 and by region weighted by population.
Table 1. BCI by Component Indicators

Notes:
1) All values are weighted by population
2) There may be some discrepancies in the average values of the component indicators due to the rescaling process that was used to correct for distortions due to missing data, particularly for year 1990
It should be noted that the global trends in the last twenty years for all three component indicators show a similar pattern of increases from 1990 to 2000 and 2011. However, reflecting the same pattern as the BCI, the progress is slower during the period 2000 to 2011 compared to the previous decade. That means that there is a noted slowdown in the progress achieved by countries starting 2000. This pattern is also seen in most of the regions, indicating quite a consistent trend of slowing down over the past decade.


