No time to lose: Meeting Canada’s Sustainable Development Goals
Canadian Center for Policy Alternatives (CCPA)
Canada’s federal government is working towards achieving the goals set out in the 2030 Agenda for Sustainable Development both at home and abroad. Yet the scale and scope of investments to date continue to fall considerably short of SDG targets. Implementing the 2030 Agenda requires concrete action and political leadership. The policy and program alternatives outlined here in the areas of taxation, public services, and the environment better position us to tackle these challenges head on.
Canada’s federal government has committed to working towards achieving the goals set out in the 2030 Agenda for Sustainable Development both at home and abroad.1 In its presentation at the 2018 High-level Political Forum on the SDGs, the government readily acknowledged that: “[a]lthough Canada is a prosperous nation, we have our challenges and more work to do to achieve the SDGs.”2
Over the course of the last three and a half years, the government has started down the path, but the scale and scope of investments to date continue to fall considerably short of SDG targets. Implementing the 2030 Agenda requires concrete action and political leadership that challenges fundamental economic inequalities and the short-term thinking that threatens the environment and future generations. The policy and program alternatives outlined here in the areas of taxation, public services, and the environment better position us to tackle these challenges head on.
Tackling Canada’s Social Deficit
Federal budget cuts following the 2008-09 recession scaled back federal programs at a significant cost to provinces, local communities, and private households. The impacts included a measurable withdrawal of public services and support programs as well as record levels of subnational government and household debt.
Provincial governments, which bear the responsibility for delivering education, social and health services, collectively now hold a higher level of debt than does the federal government.3 Households, for their part, shoulder more debt than any other sector of the Canadian economy – at 100.1% of GDP in the last quarter of 2018.4 (For comparison, the household debt-to-GDP ratio was 54% in 1990.)
By 2015, the federal government was the smallest it had been since before the Second World War—despite profound social and economic inequalities in Canada and the global challenges that slow growth and our changing climate present. Federal program spending as a share of the economy stood at 13.0% of GDP and its debt-to-GDP ratio was 31%, the lowest in the G7.5
Without question there was room to invest. Without question there was a need to invest.
Figure 1
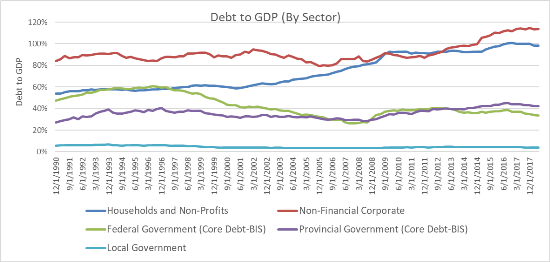 |
Source: Statistics Canada, Table 36-10-0580-01 National Balance Sheet Accounts, Market Value, Canada
Since then, the current Liberal government has made several important moves to rebuild Canada’s social infrastructure and to honour its international commitments to the SDGs, including investments in housing, clean water and children’s services for First Nation communities,6 increasing the Canada Child Benefit (CCB) and the Guaranteed Income Supplement (GIS) for single seniors, and advancing a gender equality agenda in its foreign policy and development assistance programs.
But these actions do not get us nearly close enough to the goal of more equally shared prosperity nor do they reflect the government’s capacity to act – despite the relative strength of the Canadian economy since 2016.
Low unemployment should have led to strong wage growth. Yet, year-over-year growth in hourly wages and weekly earnings since the 2008-09 recession have been modest to say the least, some years barely keeping pace with inflation. Between 2009 and 2018, the cost of living (as measured by the consumer price index) has gone up by 16.6% while average wages only eked out 5%.7
This is one marker, but a telling one. The direction and scale of new investments hasn’t turned the tide on decades of neoliberal economic policy and the damaging rise of inequality that has followed in its wake. The federal government hints at solutions but underinvests and under collects.
If the federal government has had limited impact on generating sustained economic growth and reducing inequality, it is because its plans are simply too small for the task. Federal program spending in 2017-18 was 14.5% of GDP—an increase of 1.6 percent points from 2015, but still shy of postwar levels—and slated to fall to 13.8% by 2013-24.8
On the other side of the ledger, federal revenues are also near all-time lows relative to GDP. Again, the current government has taken some positive steps, cancelling some of the previous Conservative government’s most egregious tax breaks, closing some loopholes, and adding another top tax bracket of 33% on incomes over $200,000. But its revenues as a share of GDP, at 14.5%, are still $40 billion lower than the 50-year average of 16.4%.9
Figure 2
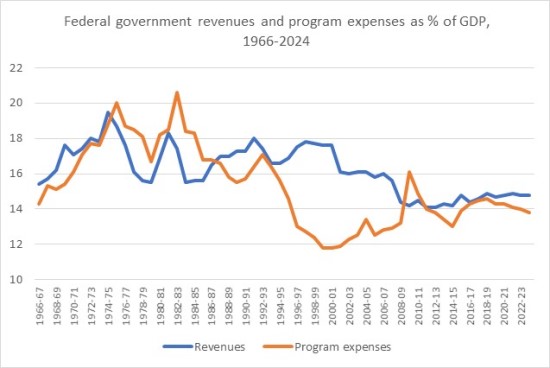 |
Source: Finance Canada (2018), Fiscal Reference Tables and Budget 2019, Annex 2.
Inequality, Wealth and Wages
Canada’s economy reflects the global trend towards growing concentration of wealth and income among those at the top – and the stagnation of incomes among everyone else. Inequality in Canada may be less extreme than in the U.S., but it grew at a faster rate here between 1997 and the onset of the last recession, during a time of robust growth and job creation. The richest one percent of earners in Canada accounted for 32% of all income gains between 1997 and 2007.10
Since the 2008-09 recession, the market income share of Canada’s top one percent has fallen off (from 15.3% in 2007 to 14.2% in 2015),11 as has their share of wealth.12 However, the richest one percent of families still hold 17% of the country’s net wealth13 and the market incomes of top earners continue to outpace others.14 Over this same time period, the bottom half of Canada’s earners actually saw their market incomes shrink by 18% when adjusted for inflation, a reflection of both an increasingly polarized labour market and rising wage inequality.15
Up until recently, real wage gains for both low-skill and middle-skill occupations associated in Canada’s extractive resource sector had helped to moderate rising wage inequality evident elsewhere. In 2014, a drop in global oil prices led to significant job losses and a decline in earnings, particularly among men, in these regions.16 Employment levels have recovered but not in this well-paid sector – a serious challenge going forward.
Figure 3
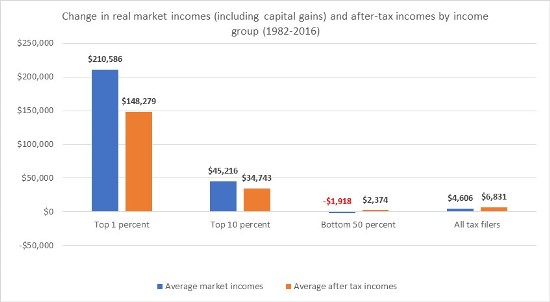 |
Source: Statistics Canada, Table 11-10-0055-01, High income tax filers in Canada.
It is essential to note that income inequality in Canada is highly racialized and gendered. Levels of income and employment are consistently lower for women, Indigenous peoples, racialized groups, new immigrants, and persons with disabilities.
The rate of employment among women is comparatively high in Canada, but they still haven’t matched those of men. Recent gains among core aged women have pushed up earnings but not appreciably narrowed the wage gap as women continue to be over-represented in low-wage jobs.17 Over half of women (56.0%) are employed in occupations involving the "5 Cs": caring, clerical, catering, cashiering and cleaning, little changed from 1987, when 59.2% of women were employed in these occupations.18
There are also marked differences in the distribution of work between different groups of women. Immigrant women’s employment, for instance, lags five percentage points behind that of Canadian-born women and 12 percentage points behind that of immigrant men. This gap persists in spite of the fact that immigrant women have higher levels of education, as a group, than non-immigrant women.19
Gaps in access to paid work, in turn, are mirrored in persistent disparities in wages. Canada’s gender pay gap is one of the highest in the OECD, ranking 30th out of 36 countries, behind all European countries and the United States.20 Full-time female employees still only earn 82 cents for every dollar that full-time male employees earn.21
The gaps are larger again among racialized, immigrant and Indigenous workers. In 2016, Indigenous women earned an average 75% of what Indigenous men did, and 57% of what non-Indigenous men earned. Racialized women earned 77 cents for every dollar that racialized men earned and 59 cents for every dollar that non-racialized men earned. And, immigrant women earned 74% percent of what immigrant men earned and 67% of what non-immigrant men did.22
Figure 4
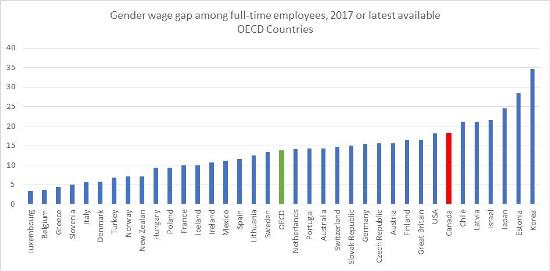 |
Source: OECD (2019), Gender wage gap (indicator).
We all live with the damaging consequences of persistent inequality in the form of poorer health, lost potential, higher social costs, and weaker community ties. The challenge is equally if not more pressing for younger generations. Recent Canadian research demonstrates that disparities in economic well-being have been growing. The spread in net worth between millennials (those born between 1982 and 1991) is larger than previous generations. Millennials in the top 25% had $253,900 or more in median net worth than Gen-Xers (those born between 1965 to 1976), while those in the bottom 25% had $9,500 or less.23
Only government transfers — in the form of seniors’ benefits, employment insurance, child benefits and the like — have saved the bottom half from being materially worse off today than a generation ago. But they are not as effective as they were in the 1980s and early 1990s in offsetting income disparities.24 “The combination of greatly increased concentration of income at the top and reduced chances of getting there for the rest signals a society that is substantially less equitable, inclusive and fair than it was three decades ago.”25
Path to Progress
Implementing the 2030 Agenda for Sustainable Development will require several important policy changes, especially in the area of taxation, public services, and the environment, along with closing the equality gaps.
Fiscal strength through progressive taxation
Decades of tax cuts have compromised the health of federal fiscal coffers. Federal revenues are presently 14.4% of GDP, lower than the 50-year average of 16.4%. This 2.0% difference will represent lost revenue of $46 billion in 2019 alone.26 Canada, in other words, doesn’t have a spending problem, it has a revenue problem.
Progressive tax reform can increase government revenues and help reverse damaging inequalities while strengthening the economy. Closing expensive tax loopholes that benefit mainly Canada’s wealthiest income earners, including the stock option deduction27 and preferential taxation of capital gains, would generate an additional $18 billion in revenues a year. Likewise, an inheritance tax on estates valued at more than $5 million, similar to the estate tax in the U.S. and many other OECD countries, would generate upwards of $2 billion a year.28
Greater regulation of tax avoidance is also key. Canada currently loses an estimated $15 billion in tax avoidance each year. Over $300 billion dollars are being parked in international tax havens. Imposing a 1% withholding tax on corporate assets held in known tax havens or putting a cap on interest payments to offshore subsidiaries would help to recoup these revenue losses. Revenue can also be recuperated from foreign-based e-commerce firms (e.g., Google, Facebook and Netflix) that do not currently charge HST on the services they provide Canadians (as their Canadian competitors are required to do), generating $169 million in new revenues according to the Auditor General.29
Canada’s new price on carbon is an important albeit modest means for meeting Canada’s medium-term GHG emission reduction targets and international obligations under the Paris Agreement. But a higher carbon price floor is needed in order to reach our 2030 GHG target. Revenues generated through this charge—and the cancellation of fossil fuel industry subsidies—could be used to offset the impact of the higher tax on lower-income households and support investments in renewable energy, energy efficiency, public transit, and transition measures for the most affected workers and communities.
Progressive taxation is an essential tool in addressing poverty and inequality and in ensuring that Canada meets its commitments to the Sustainable Development Goals. The government new Gender Budgeting Act will help to ensure that all government programming – including tax policies – are designed with the differences between men and women in mind. This year’s “Gender Report” released with Budget 2019 represents the most comprehensive effort to date to identify the characteristics of the groups expected to benefit from government policy and their distributional impacts—information essential to developing and implementing public policy that delivers.30
Changes to student loan programs introduced in Budget 2019, for example, will benefit women who pursue post-secondary education in large numbers and carry large student debts for their efforts. The extension of parental leave for graduate students and the new Dementia Strategy will also primarily benefit women because, in the first instance, women are more likely than men to take up parental leave, and in the second case, are at greater risk of developing dementia.
By contrast, men are expected to be the primary beneficiaries of research and development tax credits—in their roles as shareholders (men receive a larger share of investment income) and as workers in scientific and technical occupations where men outnumber women. With a better understanding of the intended (and unintended) impacts of policy, governments can take steps to help level the playing field.
Public Service Delivery: Health; Child Care; and Housing
Investments in public services create jobs and make real-life improvements for all Canadians. Yet as a country, Canada is not investing enough in areas like health care, child care, seniors care, or affordable housing. Nor is the government doing enough to support workers in precarious jobs or those facing job instability and economic insecurity.
The current federal government came to office in 2015 promising to address Canada’s sizable social deficit. Tax policies are powerful tools, but they need to be supplemented with well-designed income security programs and public services that provide a foundation for all to thrive.
Health Care
Early efforts to tackle the stresses on Canada’s public health care system were dashed when the government abandoned negotiations towards a new Health Accord with the provinces and territories and pushed through a series of bilateral funding deals wholly inadequate to meeting the future needs. The federal government’s offer to increase provincial health transfers annually by nominal GDP or 3%—whichever is higher—has created a shortfall of $31 billion in lost health services. For the worst-hit provinces, the gap ranges from $3.4 to $13.6 billion.31
In the absence of meaningful federal investment, provinces are cutting services, pursuing greater privatization, and downloading responsibilities to families, all of which undercut equitable access to quality care. Meanwhile local health agencies struggle to respond to the exponential rise in opioid-related deaths. Higher levels of federal funding are needed to put public health care on a stable footing and to facilitate the expansion of needed mental health services, dental care, and home care.
Canada is the only country in the world with a universal public health care system that does not include access to prescription medication. Approximately 3.5 million Canadians lack even basic drug coverage, and around one in four Canadians fail to take needed medication as prescribed due to high costs.32 The government’s Advisory Council on the Implementation of National Pharmacare is releasing its recommendations for a national program this June.33 The jury is out on whether the government will opt for a single payer pharmacare system that has the potential to improve health care for all or a fill-in-the-gaps system that protects Canada’s profitable private insurance market and continues ensuring that Canadians will continue to pay the highest prices on earth for prescription medications.34
Child Care
Canada also stands at the bottom of the league table with respect to support for early learning and child care. Canada spends an estimated 0.5% of GDP annually on child care—half what most comparable countries spend—and much of this spending is concentrated in once province, Quebec.35 The lack of affordable, high quality child care is a huge barrier to healthy child development and women’s economic equality
In 2017, the federal government announced an investment of $7.5 billion over 11 years and subsequently negotiated agreements with all provinces and territories to enhance their child care systems. The agreements claim to adhere to the principles of accessibility, affordability, quality, flexibility and inclusivity, but these principles are not operationalized.
These efforts have produced mixed results. Some groups—such as infants, children with disabilities, new immigrants, rural communities, and parents working or studying part-time or nonstandard hours—continue to be poorly served. To make real progress, the federal government must assert a leadership role and rely on the best available evidence in building a comprehensive system of child care for all.
Housing
Shelter is a basic need, yet for too many Canadians, it is a scramble every night to secure a place to rest. Many more are at risk of homelessness because of the very high cost of shelter, meagre stock of affordable of housing, inadequate incomes, and family violence and illness. The federal government’s long-overdue National Housing Strategy, announced in 2017, promises $11.2 billion over 11 years to cut chronic homelessness in half, remove 530,000 families from housing need, and invest in the construction of up to 100,000 new affordable homes.36
Over the last ten years, average housing prices have gone up by 80% Canada-wide since their lows in the winter of 2009, and more than doubled in cities like Vancouver and Toronto.37 New home owners have taken on crippling levels of debt;38 other have been pushed out of the housing market altogether, in turn, driving up competition for limited rental accommodation.
In 2016, fully 40% of Canadian households living in rental accommodation spent over 30% of gross household income on rent, while almost one in five renters spent over 50%. In total, over 1.6 million households in “core housing need” – spending more than one-third of their before-tax income on housing that is substandard or doesn’t meet their needs.39
The National Housing Strategy includes several different funding programs to support the creation of new affordable housing in the private market and the expansion and preservation of existing social housing and coops targeting different groups in need. A key feature of the Strategy is the creation of a Canada Housing Benefit that will provide an average of $2,500 per year to eligible low-income households to assist with rental payments.
It takes time to plan, finance, and build housing, but the glacial pace of new construction is troubling. Much of the federal money that was announced is contingent on cost-sharing with the provinces and territories, the level of government directly responsible for housing. At the end of 2018, only three bilateral agreements had been concluded—and people in critical housing need continue to wait.
It’s important to note that the National Housing Strategy’s targets — about 6,000 new builds annually over the next decade — represent just one-third of the total volume of Canada’s new annual builds from the 1970s and 1980s, keeping in mind that Canada’s population has grown since that time. The vast majority of the NHS funds are back-loaded until after the next federal election in 2019, and only $15 billion worth is new money.40
Additional investment will be needed to make any kind of dent in the supply of affordable housing in the private, public and nonprofit sectors – and to provide needed supports for vulnerable populations such Indigenous peoples living off reserve, women fleeing violence, people with disabilities, and frail seniors.
Closing the Gap: Indigenous Peoples
Canada has been called out repeatedly by the UN Human Rights Council41 and other agencies for its failure in addressing the glaring gap in living conditions and quality of life between Indigenous peoples and the non-Indigenous population.
Indigenous peoples are three times as likely to live in housing that is in need of major repairs (a problem that is particularly acute for the Inuit population in the far north of Canada)42 and over 50 First Nations communities live without safe drinking water.43 Indigenous people experience higher than average rates of incarceration44 as well as significantly higher rates of violent victimization.45 A National Inquiry into Missing and Murdered Indigenous Women and Girls has been established in response to calls from Indigenous families and communities and organizations, as well as the UN CEDAW Committee.46
Redressing past wrongs and establishing an equitable and just relationship with First Nations, Métis and Inuit people is fundamental to meaningful reconciliation as set out in the 2015 Truth and Reconciliation Commission.47 Funding for health and social services, education and employment, physical infrastructure, and support for core governance capacity are critical to addressing the deep roots of persistent poverty and marginalization.
The federal government has significantly increased funding since 2015, from $11.0 billion to over $15 billion in 2017-18, effectively lifting the historical 2% cap on funding for Indigenous services. It will continue to take many years and concerted effort to extinguish the discriminatory gap in funding and build a strong foundation for future prosperity and self determination.
Canada’s New Poverty Reduction Strategy
The federal government took several important steps in the first years of its mandate to tackle poverty, notably by reforming and enhancing Canada’s child benefit system, boosting benefit levels for poor single seniors, and introducing a new Canada Workers Benefits – measures that taken together have lifted almost half a million people out of poverty.48
As welcome as these new policies have been, the task of adequately tackling poverty and inequality remains far from complete. For years, the anti-poverty community and its allies have worked tirelessly for a meaningful federal plan to eradicate poverty and the investments needed to make this a reality. This past year, the government released its plan: Opportunity for All. With this announcement, the government has for the first time set a target for reducing poverty in Canada, defined an official poverty line, and established a framework and a process for reporting publicly on progress.49
At the same time, the Strategy does not include any new investments in the programs needed to achieve its goals. Indeed, Canada’s new plan is more of a framework than a strategy to accelerate poverty reduction. A strategy implies a plan to get from where we are to where we seek to go – and, crucially, the resources to back it up. On this score, low income Canadians are still waiting.
Modernizing and enhancing Canada’s income security programs is essential to achieving these targets, as well as pursuing measures that enhance affordability and economic security and tackle the grossly inequitable distribution of market incomes.50 This includes taking action to:
- Raise the incomes of those living in deepest poverty through conditional transfers to the provinces and territories to increase social assistance benefits – with specific consideration for vulnerable populations (persons with disabilities, lone‐parent families, new immigrants, and women).51
- Reform the Employment Insurance program by easing eligibility requirements, extending benefit durations, and increasing benefit rates. Introducing a benefit floor would be a meaningful step towards reducing inequality for low income workers.
- Improve the earnings and working conditions of those in the low-wage workforce by setting a federal minimum wage of $15 per hour for workers under federal jurisdiction and granting full labour rights and protections to migrant workers.
- Establishing an industrial policy that emphasizes the creation of value-added jobs across the economy including in female-dominant sectors, rebuilds manufacturing capacity, and supports the transition to a zero-carbon economy grounded in the principles of decent work and environmental sustainability, providing support to workers and communities negatively affected.
Taken together, these actions would strengthen Canada’s social safety net considerably and create a more flexible and effective platform for successfully eliminating poverty and achieving Canada’s 2030 targets.
Canada can afford to be a leader in meeting the vision and goals set out in the 2030 Agenda for Sustainable Development – at home and abroad. With a stronger, more equitable fiscal foundation, Canada will be in much better condition to weather economic, social and environmental challenges in the coming decades, while investments in our public services and infrastructure will ensure that all benefit from shared prosperity for generations to come.
|
Civil Society Resources on the 2030 Agenda for Sustainable Development
Progressing national SDGs implementation: An independent assessment of the voluntary national review reports submitted to the United Nations High-level Political Forum on Sustainable Development in 2018. The Third Edition in an annual series commissioned by civil society organisations. Canadian Council for International Cooperation. BCCIC and Global Affairs Canada (2018), Where Canada Stands, Volume II - 2018. A Sustainable Development Goals Shadow Report. Commissioner of the Environment and Sustainable Development (2018), Report 2—Canada’s Preparedness to Implement the United Nations’ Sustainable Development Goals, Spring 2018. Office of the Auditor General of Canada. Margaret Biggs and John W McArthur (2018), A Canadian North Star: Crafting an advanced economy approach to the Sustainable Development Goals, Working Paper 111, Global Economy and Development. Washington: Brookings Institution. John McArthur and Krista Rasmussen (2017), Who and what gets left behind? Assessing Canada’s domestic status on the Sustainable Development Goals, Working Paper 108, Global Economy and Development. Washington: Brookings Institution. |
Notes:
1 See: Government of Canada, Canada takes action on the 2030 Agenda for sustainable development and Sustainable Development Goals Data Hub
2 Government of Canada (2018), Canada’s Implementation of the 2030 Agenda for Sustainable Development. Voluntary National Review, p. 126.
3 CCPA (2016), “Macroeconomic Policy,” Alternative Federal Budget 2016. Canadian Centre for Policy Alternatives.
4 Statistics Canada, Table 38-10-0235-01, Financial indicators of households and non-profit institutions serving households, national balance sheet accounts.
5 Government of Canada (2016), Budget 2016: Growing the Middle Class.
6 In a landmark ruling, the Canadian Human Rights Tribunal ordered the Canadian government in 2016 to take active measures to ensure that all First Nations children living on and off reserve have equitable access to all government funded services. This has resulted in much enhanced children’s services to address systemic inequities.
7 Statistics Canada, Table 14-10-0064-01, Employee wages by industry, annual.
8 Finance Canada (2018), Fiscal Reference Tables.
9 Ibid.
10 CCPA (2016), “Poverty and Income Inequality,” Time to Move On: Alternative Federal Budget 2016. Canadian Centre for Policy Alternatives, p. 98.
11 Income is pre-tax from all sources including capital gains. Statistics Canada, Table 11-10-0055-01, High income tax filers in Canada.
12 Statistics Canada, Table 36-10-0585-01, Distributions of household economic accounts, wealth, by characteristic, Canada, annual.
13 Carlotta Balestra and Richard Tonkin (2018), “Inequalities in household wealth across OECD countries: Evidence from the OECD Wealth Distribution Database,” Working Paper 88, Statistics and Data Directorate, OECD. For a discussion of wealth concentration in Canada, see: David Macdonald (2018), Born to win: Wealth concentration in Canada since 1999. Canadian Centre for Policy Alternatives.
14 Statistics Canada, Table 11-10-0055-01, High income tax filers in Canada. Among the top one percent, earnings (including capital gains) more than doubled between 1982 and 2015, reaching $615,300, and then falling back to $508,700 in 2016. Just over half of the decline between 2015 and 2016 was attributable to lower dividend income in 2016, following a surge in earnings and capital gains reported in 2015 (in advance of the new federal personal income bracket for high income earners). A drop in paid employment income, especially in Alberta, largely accounted for the rest of the overall decline. Statistics Canada (2018), “Effective tax rates and high income Canadians, 2016,” The Daily, Oct. 25, 2018.
15 Statistics Canada, Table 11-10-0055-01, High income tax filers in Canada.
16 Nicole M. Fortin and Thomas Lemieux (2017), “Changes in Wage Inequality in Canada: An Interprovincial Perspective,” Nicole M. Fortin and Thomas Lemieux,” Income Inequality: The Canadian Story, Green, Riddell and St-Hilaire (eds.), Institute for Research on Public Policy.
17 Diane Galarneau and Eric Fecteau, The Ups and Downs of Minimum Wage. Ottawa: Statistics Canada, 2014.
18 Melissa Moyser (2017), “Women and Paid Work,” Women in Canada: A Gender-based Statistical Report, Statistics Canada, Catalogue no. 89-503-X, p. 23.
19 These figures are based on the 2016 Census of Population for the population aged 15 to 64 years.
20 OECD (2019), Gender wage gap (indicator).
21 These figures refer to the median earnings of full-time employees. Taking both full-time and part-time workers into account, women earned an average of 73 cents for every dollar men earned in 2016. Statistics Canada, Table 11-10-0031-01, Labour income profile of tax filers by sex.
22 All figures refer to employment income for all workers aged 15 and older, based on the 2016 Census of Population.
23 Andrew Heisz and Elizabeth Richards (2019), “Economic Well-being Across Generations of Young Canadians: Are Millennials Better or Worse Off?” Economic Insights, Statistics Canada, Catalogue no. no. 11-626-X — 2019006 - No. 092
24 John Myles and Keith Banting (2013), “Inequality and the fading of redistributive politics,” in Inequality and the Fading of Redistributive Politics, Vancouver: UPC Press, 2013.
25 David Green, Craig Riddell and France St-Hilaire (2017), “Income inequality in Canada: Driving forces, outcomes and policy,” Income Inequality: The Canadian Story, Green, Riddell and St-Hilaire (eds.), Institute for Research on Public Policy, p. 25.
26 CCPA (2018), No Time to Lose: Alternative Federal Budget, 2019. Canadian Centre for Policy Alternatives, p. 8.
27 The stock option deduction was recently capped at $200,000 in Budget 2019.
28 See CCPA (2018 ), “Fair and Progressive Taxation,” No Time to Lose, Canadian Centre for Policy Alternatives.
29 Auditor General of Canada (2019), Report 3 – Taxation of E-Commerce, Spring Reports of Auditor General of Canada.
30 Government of Canada (2019), Gender Report, Budget 2019.
31 Canadian Health Coalition & Ontario Health Coalition (2017), Health Accord Break Down: Costs & Consequences of the Failed 2016/17 Negotiations.
32 Canadian Health Coalition (2016), A National Public Drug Plan for All. Brief to Standing Committee on Health for the Study of the Development of a National Pharmacare Program.
33 Health Canada, Advisory Council on the Implementation of National Pharmacare.
34 See: David Macdonald and Toby Sanger (2018), A Prescription for Savings. Canadian Centre for Policy Alternatives.
35 Early learning and child care: How does Canada measure up? International comparisons using data from Starting Strong II. (2006) BRIEFing NOTE. Toronto: Childcare Resource and Research Unit.
36 Government of Canada (2017), Canada’s National Housing Strategy: A Place to Call Home.
37 Canadian Real Estate Association, MLS Home Price Index.
38 The indebtedness of Canadian households has risen steadily since the crisis: from 150% of disposable income in 2008 to 170% today. See: CMHC (2018), “Household debt-to-income ratio near record high,” Housing Observer, December 13, 2018.
39 Statistics Canada (2017), Core housing need. 2016 Census. Catalogue no. 98-509-X2016001.
40 Patrick Gossage (2018), “Good review (mostly) for the National Housing Strategy,” Policy Options, Feb. 22, 2018.
41 UN Human Rights Council (2018), Report of the Working Group on the Universal Periodic Review: Canada. July 11, 2018.
42 Statistics Canada, 2016 Census of Population. Catalogue Number 98-400-X2016164.
43 Government of Canada, Ending long term drinking water advisories: website.
44 Jamil Malakieh (2018), Adult and youth correctional statistics in Canada, 2016/2017, Statistics Canada, Juristat, Catalogue no. 85-002-X.
45 Jillian Boyce (2016), Victimization of Aboriginal people in Canada, 2014. Statistics Canada, Juristat, Catalogue no. 85-002-X
46 The Inquiry’s goal “is to build a foundation that allows Indigenous women and girls to reclaim their power and place” by revealing the ongoing impact of colonization and setting out final recommendations that address systemic violence against Indigenous women and its underlying causes. http://www.mmiwg-ffada.ca/
47 Truth and Reconciliation Commission of Canada (2015), Honouring the Truth and Reconciling the Future.
48 The Market Basket Measure, Canada’s new official poverty line, has been used to calculate these figures.
49 The targets have been criticized for lacking ambition. Indeed, the target for 2020 – to reduce the low income rate by 20% against the 2015 baseline – was achieved nine months prior to the announcement. See: Government of Canada (2018), Opportunity for All: Canada’s First Poverty Reduction Strategy.
50 For a detailed discussion of these proposals and others, please see: Canadian Centre for Policy Alternative (2018), No Time to Lose: Alternative Federal Budget 2019.
51 Currently, the federal government transfers $13.3 billion per year to the provinces and territories under the Canada Social Transfer. Under the current formula, federal transfers have been declining as a share of GDP for several years. See Government of Canada (2019), Investing in the Middle Class: Budget 2019.