BASIC CAPABILITIES INDEX (BCI) 2009

Publication_year: 
2009
Annual report: 
Yes
Summary: 
The BCI uses an alternative methodology to register the progress – or lack of progress – towards compliance with the Millennium Development Goals. This index constitutes a new methodology that complements in numerous respects the human development indexes most commonly used.
 

The BCI uses an alternative methodology to register the progress – or lack of progress – towards compliance with the Millennium Development Goals. This index constitutes a new methodology that complements in numerous respects the human development indexes most commonly used.

To reach an acceptable BCI does not imply a high level of social development. It merely signifies that the country has achieved universal coverage of minimum essential needs that are a prerequisite for advancing towards greater wellbeing. It is a departure point, not a destination.


Basic Capabilities Index: a starting point
More effort required from the weakest
All Quiet on the Poverty Front
Evolution by countries and regions
               

BCI 2009 country by country

           
  Download BCI 2009 (Countries listed in alphabetical order, PDF) BCI-2009-alphabetical-eng.pdf
Download BCI 2009 (Countries listed according to BCI value, PDF) BCI-2009-value-eng.pdf


AttachmentSize
BCI2009_eng.pdf1.57 MB
Image_block: 

All Quiet on the Poverty Front

Publication_year: 
2009
Annual report: 
Yes
   

The 2009 Basic Capabilities Index (BCI) constructed by Social Watch shows that, even without the not-yet-registered impact of the world economic crisis, most countries in the world are at risk of not achieving their poverty reduction commitments. A significant proportion of the 175 countries considered (42.3%) obtained a BCI rating of low, very low or critical, and barely half the countries for which data is available made progress (52.7%). Countries that started from a very low level are regressing, which worsens the gap and increases the disparity between countries and regions. Only Europe and North America could potentially reach acceptable BCI values by the year 2015. Southern Asia is progressing fast, but its starting point is so low that it will still be far from acceptable in the coming decade. Latin America and the Caribbean are not progressing at all and 41% of the countries that have regressed on the BCI are in sub-Saharan Africa. The numbers reveal a dramatic situation of global inequity.

click to enlarge

click to enlarge


> Basic Capabilities Index: a starting point > More effort required from the weakest > Evolution by countries and regions


AttachmentSize
BCI2009_allQuiet.pdf1.6 MB
Region: 
right

BCI 2009 in the news

Publication_year: 
2009
Annual report: 
Yes

Pocos avances y una perspectiva nada alentadora en cuanto al cumplimiento de los compromisos internacionales asumidos por los Estados sobre reducción de la pobreza y desarrollo social es la conclusión que surge de Sin novedad en el frente de la pobreza, el título que presenta la edición 2009 del índice de Capacidades Básicas (ICB) de Social Watch. Según las estimaciones del ICB, de no modificarse el ritmo actual, la gran mayoría de las regiones del mundo –exceptuando a Europa y América del Norte– estarán muy lejos de alcanzar un nivel siquiera aceptable de satisfacción de las necesidades básicas de sus habitantes

MEDIO: 

Agenda global/ladiaria

Region: 
footer

Basic Capabilities Index: a starting point

Publication_year: 
2009
Annual report: 
Yes


Social Watch developed the BCI as an instrument to monitor the evolution of basic indicators and make comparisons between and within countries. This is a summary-index that compares and classifies countries according to their progress in social development by evaluating their situation in terms of minimum basic capabilities – structural dimensions that represent the indispensable starting conditions to guarantee an adequate quality of life.

The index identifies situations of poverty and it consists of three indicators:* the percentage of children reaching fifth grade, survival until the age of 5, and the percentage of births attended by skilled personnel. These indicators express different dimensions that are considered in internationally agreed development objectives (education, infant health and reproductive health). The BCI does not use income as an indicator. It defines poverty not in terms of money, but in different aspects of people’s actual condition and their greater or lesser possibility of having their human rights fulfilled.

The BCI is based on the latest available information for each country and it is easy to construct and can be applied at the sub-national and municipal levels. Since it does not include income as one of its components, it can be built without having to resort to costly household surveys, which is the problem with indexes based on income, such as the World Bank measure of the number of people living on less than one or two dollars a day, or the UNDP’s Human Development Index, which combines income with health and education indicators. Precisely because it dispenses with income as an indicator, the BCI has proved to be highly correlated with the measure of other human capabilities and, in particular, the 41 different indicators used to measure progress towards the different Millennium Development Goals agreed internationally in the year 2000. Contrary to the MDGs, though, the BCI can be used to assign a value to each country, so comparisons can be made with other countries and the progress can be evaluated over time.

The BCI indicators show maximum values when all women are attended by skilled health personnel at delivery,  when no child drops out of school before completing the fifth grade and when infant mortality is brought down to its lowest possible level of less than five deaths among children under five years old per thousand live births. These indicators are closely linked to the other basic capabilities the members of a society should have, capabilities that reinforce each other to make better individual and collective development possible.

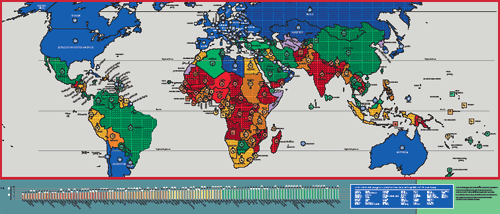
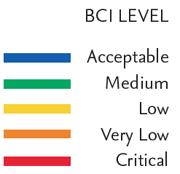
The 2009 BCI was calculated for 175 countries, and these are grouped in various categories**. The countries in the most serious situation are those with a Critical BCI (less than 70 points). In the Very Low BCI category (from 70 to 79 points) there are countries facing major obstacles to achieving well-being for the population. The countries with Low BCI (from 80 to 89 points) are at an intermediate level as regards the satisfaction of basic needs, and their performance varies in some dimensions of development. The countries that have progressed and now satisfy most or all the population’s basic capabilities are in the two categories with the highest values: Medium BCI (from 90 to 97) and Acceptable (more than 98 points and more).

The BCI of a country approaches 100 when there is universal access to the three minimum levels of social coverage mentioned above. These factors indicate the satisfaction of the most fundamental of all social rights, which are access to adequate health care, and universal, good quality basic education.

Social Watch understands that a BCI value close to the maximum reflects the “dignity for all” proclaimed by the Universal Declaration of Human Rights. Reaching this level does not mean that a country has attained all the goals of social well-being that are desirable in a society; it merely indicates a starting point towards those goals.


* The BCI originated in the Quality of Life Index developed by the non-government organization Action for Economic Reforms (Philippines), which was derived from the Capability Poverty Index proposed by Professor Amartya Sen and popularized as the UNDP Human Development Index.

** The methodological process designed to estimate BCI values when there is a lack of information for one of the indicators that makes up the value consists of the following.

a) Countries are considered on a regional basis, and only those that are in a similar relative situation to the country for which information is lacking are considered. This implies the assumption that countries are similar in terms of performance to neighbouring countries at a similar level of development. (Countries designated “high income” by the World Bank are classified in sub-regions, thus increasing the total from 8 to 15 regions.)
b) An average of the values for the missing indicator is made just from the countries in the same region.
c) The average of indicators with information is estimated for all the countries.
d) The arithmetical mean or average is calculated among the mean values calculated in “c” (only among countries in the region corresponding to each concrete estimation need).
e) The value obtained in “d” is subtracted from each value obtained in “c”, which yields a correction factor for each country.
f) The value obtained in “b” is added to the value obtained in “e”, which yields a correction of the regional mean either up or down in function of the mean performance registered for each country, in the two indicators for which information is available. 
g) And lastly, the value obtained in “f” is imputed to the countries in that region and in a similar relative situation for which the data in question is not available.
h) If as a result of the procedure outlined above the indicator exceeds 100 points, and as we are dealing with a percentage, the value of 100 points is given as this is the maximum possible.


> More effort required from the weakest > All Quiet on the Poverty Front > Evolution by countries and regions
AttachmentSize
BCI2009_StartingPoint.pdf1.6 MB
Region: 
right

Evolution by countries and regions

Publication_year: 
2009
Annual report: 
Yes
 
Number of countries
in each BCI level
by reference year
click to enlarge


click to enlarge

In 2009, almost half the countries of the world (42.1%) have a BCI value that is low, very low or critical. At the current rate of progress, in 2015 the average BCI value of the countries in South Asia and sub-Saharan Africa will barely be at the very low level, and all the other regions of the world except for Europe and North America will still fall far short of the acceptable level.

Since 2005, less than half of the countries of the world have made progress (43%) and almost one fourth have regressed. A third of the countries (33%) have not managed to raise their BCI value by more than 1% and only one out of every six countries (18%) shows significant progress.

There is an enormous gap in living conditions between the region with the highest average BCI (North America with 99 points) and the regions with the worst averages (sub-Saharan Africa with 70 points and South Asia with 71).

South Asia was the region with the worst BCI average in 2004. It is making fast progress, but the situation is still extremely critical.

In sub-Saharan Africa, the situation is similarly critical, as shown by an average  BCI value of only 70 points, and the average evolution shows an improvement of a mere 0.6%. At this rate it would take centuries to achieve the social development goals internationally agreed for 2015! East Asia and the Pacific, like Central Asia, show some results in improving their basic capabilities, with an average progress of around 2% in each. North America, the Middle East and North Africa all registered rates of progress of 3% and more, but this is less remarkable because they departed from a better situation and the effort required is therefore less.

The latest data gives cause for concern about Latin America and the Caribbean, a region that already ranked  low in terms of basic capabilities, and even regressed (by -0.2%). The only regions that have remained at the acceptable level on the index are Europe and North America. Europe has held steady with a positive variation of 0.6%, while North America has enjoyed a considerable increase in its BCI average (2.9% over the 2004 value). 

> Basic Capabilities Index: a starting point > More effort required from the weakest > All Quiet on the Poverty Front


AttachmentSize
BCI2009_evolutionCountries.pdf843.16 KB
Region: 
right

More effort required from the weakest

Publication_year: 
2009
Annual report: 
Yes
   

By combining what each region has reached in BCI points (represented as height in the graph) and the further steps still needed to achieve 99+ in BCI points (that is, the distance to overcome to reach an “acceptable” level) a relative position is obtained for each region and the graph looks like a  slope. Thus, the BCI level would be the height of the mountain while the effort required is the distance to the top. The effort required* from the climbers, representing different regions, to reach acceptable BCI levels is far from being equal.

The countries with low BCI not only have a greater distance to cover to achieve a basic dignity for all their people, but they face a steep slope. Imagine a country where nine out of ten children go to school. The distance to the education goal is just 10% and to cut by half the number of children without education the government only needs to increase the number of teachers and school facilities by 5%. In a country where only 20% of children go to school, the gap to the goal is 80% and to cut it by half implies that the government has to build schools and hire teachers for 40% of the children, which means trebling the present capacity. And that would still leave 40% of the children out of school, which is far from acceptable.

The Universal Declaration of Human Rights commits all countries to achieve “dignity for all”, but the means to do that are not there where they are needed the most.

EFFORT REQUIRED*


The effort required to achieve the goal is the result of an equation that divides the current BCI value by an estimate of the relative distance that lies ahead. This relative distance is represented by the ratio between what is missing from each region to achieve an acceptable BCI value (BCI = 99.5) and the maximum verified inequality between regions (28.7 points of BCI that mediate between North America and Sub-Saharan Africa).
For ease of reading, the result has been multiplied by 100 (shifting from proportion to percentage).
Thus the incline that separates each region represents, at the same time, its absolute difference in the index (height) and the relative disadvantage, or lag (distance), resulting from the position of each region in the race.


> Basic Capabilities Index: a starting point > All Quiet on the Poverty Front > Evolution by countries and regions


AttachmentSize
BCI2009_moreEffort.pdf843.16 KB
Region: 
right