Gender Equity Index (GEI) 2008
|
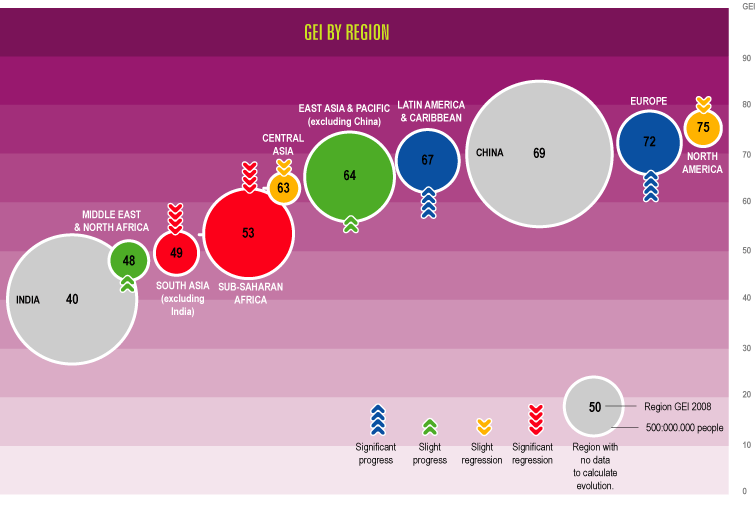
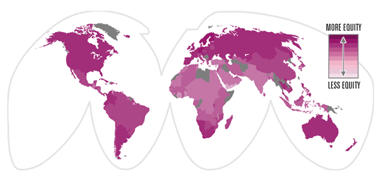
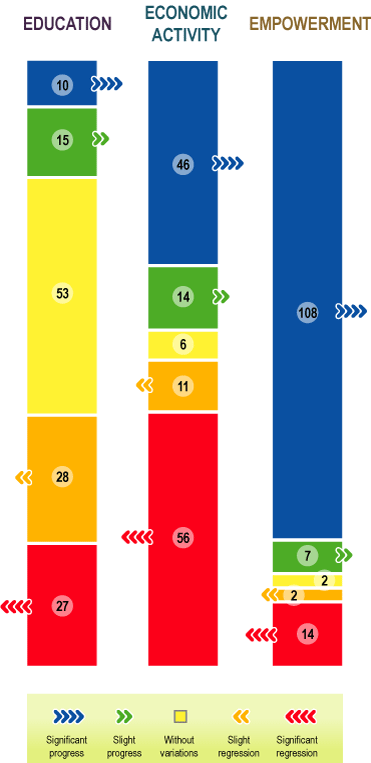
More than half the women in the world live in countries that have made no progress in gender equity in recent years. This is the main conclusion of the Social Watch 2008 Gender Equity Index (GEI) which, for the first time, shows recent evolution and trends in bridging the gap between men and women in education, the economy and empowerment. The GEI 2008 illustrates that the greater equity levels to be found in education are not paralleled by acceptable levels in the economic field nor in the empowerment of women. Political empowerment is the area where most progress has been made in recent years as a result of active policies, yet economic equity shows disparate results, with as many countries regressing as those where there is progress. In education equity is comparatively closer, but the trend for many countries is to regress. Difficulties in reaching equity cannot be justified by a lack of resources: the GEI mapping and that of each of its components show that – regardless of income levels – each country can reduce gender disparity through adequate policies.
|
 |
|
|
 |
|
The GEI has been computed for 42 countries in Sub-Saharan Africa, 37 in Europe, 28 in Latin America and the Caribbean, 17 in the Middle East and North Africa, 18 in East Asia and the Pacific, 7 in Central Asia, 6 in South Asia and 2 in North America. Together these countries represent more than 94% of the world's population. Education gap_basic data (.rtf) |
|
FOR THE PRESS Contacts/Spokespeople: Roberto Bissio Emily Joy Sikazwe Genoveva Tisheva |
| Attachment | Size |
|---|---|
| GEI2008_eng.pdf | 780.43 KB |
| GEI08exterior_eng.gif | 439.18 KB |
| GEI08interior_eng.gif | 370.1 KB |
CZECH VERSION OF THE GENDER EQUITY INDEX 2008 (pdf)
| Attachment | Size |
|---|---|
| 2008-Czech-Republic-GEI.pdf | 2.26 MB |
Economic Activity Gap
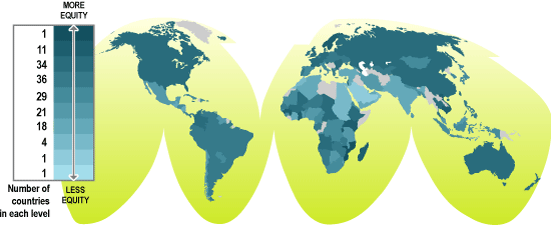
The Economic Activity Gap is estimated from the gender gap in the following indicators:
- economic activity rate
- estimated earned income
Equity levels in economic activity are halfway between the quasi-equity found in education and the alarming inequity persisting in empowerment indicators. The countries showing progress in this dimension are outnumbered by those evidencing regression.
Globally, the economic activity gap between women and men seems to be increasing, since more than half of the countries for which there is data experience regression, most of them severe. This setbacks in the participation of women in the economy is at the root of most of the national regressions registered in the total GEI.
The biggest regressions in the economic dimension come from Eastern Europe. In Latvia, Belarus, Slovakia and Macedonia, the transition toward a market economy in the early 1990's increased the gender gap in the economy. Among the 15 top places in terms of the gender gap, the Nordic countries - Sweden, Norway, Iceland, Denmark and Finland - share the honour with ten of the poorest countries in the world: Mozambique, Burundi, Rwanda, Cambodia, Ghana, Viet Nam, Uganda, Madagascar, Kenya and Guinea.
| Economic Activity gap_ basic data (.rtf) |
Economic Activity gap
| Mozambique | 91.5 | |
| Burundi | 88.1 | |
| Rwanda | 84.5 | |
| Sweden | 83.8 | |
| Cambodia | 83.5 | |
| Ghana | 82.5 | |
| Norway | 81.9 | |
| Viet Nam | 81.2 | |
| Uganda | 81.1 | |
| Madagascar | 80.8 | |
| Bahamas | 80.7 | |
| Kenya | 80.6 | |
| Guinea | 79.8 | |
| Vanuatu | 79.5 | |
| Iceland | 78.8 | |
| Denmark | 78.6 | |
| Finland | 78.5 | |
| Mali | 77.3 | |
| Burkina Faso | 76.6 | |
| New Zealand | 76.1 | |
| Lithuania | 75.6 | |
| Israel | 75.2 | |
| Australia | 75.2 | |
| Kazakhstan | 75.1 | |
| Chad | 74.9 | |
| Romania | 74.6 | |
| Canada | 73.8 | |
| China | 73.3 | |
| Azerbaijan | 73.3 | |
| Barbados | 73.2 | |
| United Kingdom | 72.8 | |
| Belarus | 72.7 | |
| United States of America | 72.3 | |
| Moldova | 71.8 | |
| France | 71.7 | |
| Thailand | 71.7 | |
| Bulgaria | 71.6 | |
| Angola | 71.3 | |
| Switzerland | 71.3 | |
| Russian Federation | 71.2 | |
| Estonia | 71.2 | |
| Latvia | 71.0 | |
| Croatia | 70.7 | |
| Netherlands | 70.7 | |
| Slovenia | 70.6 | |
| Central African Republic | 70.0 | |
| Ethiopia | 69.7 | |
| Colombia | 69.7 | |
| Portugal | 69.0 | |
| Uzbekistan | 68.9 | |
| Poland | 68.8 | |
| Hungary | 68.3 | |
| Cyprus | 68.2 | |
| Germany | 67.6 | |
| Slovakia | 67.1 | |
| Zimbabwe | 67.0 | |
| Ukraine | 66.9 | |
| Hong Kong | 66.0 | |
| Gabon | 65.9 | |
| Niger | 65.8 | |
| Kyrgyzstan | 65.8 | |
| Tajikistan | 65.8 | |
| Bolivia | 65.7 | |
| Namibia | 65.6 | |
| Jamaica | 64.7 | |
| Brazil | 64.6 | |
| Ecuador | 64.3 | |
| Belgium | 64.2 | |
| Czech Republic | 64.0 | |
| Zambia | 64.0 | |
| Uruguay | 63.9 | |
| Philippines | 63.5 | |
| Peru | 63.4 | |
| Ireland | 63.3 | |
| Argentina | 61.9 | |
| Albania | 61.9 | |
| Senegal | 61.3 | |
| Greece | 61.2 | |
| Austria | 61.0 | |
| Gambia | 60.8 | |
| Venezuela | 60.8 | |
| Panama | 60.7 | |
| Luxembourg | 60.1 | |
| St Vincent and Grenadines | 59.5 | |
| St Lucia | 59.1 | |
| Maldives | 58.6 | |
| Singapore | 58.6 | |
| Guinea-Bissau | 58.3 | |
| Mongolia | 58.2 | |
| Spain | 58.2 | |
| Lesotho | 57.6 | |
| Congo, Rep. | 57.4 | |
| Mauritania | 57.3 | |
| Cameroon | 57.1 | |
| Nepal | 57.0 | |
| Djibouti | 56.2 | |
| Paraguay | 55.6 | |
| Macedonia | 55.5 | |
| Japan | 55.3 | |
| Benin | 54.7 | |
| Italy | 54.6 | |
| Eritrea | 54.3 | |
| Costa Rica | 54.3 | |
| Korea, Rep. | 53.9 | |
| Trinidad and Tobago | 53.7 | |
| Honduras | 53.6 | |
| Bangladesh | 53.5 | |
| Indonesia | 52.8 | |
| Sierra Leone | 52.8 | |
| Cuba | 52.0 | |
| South Africa | 51.4 | |
| El Salvador | 51.2 | |
| Dominican Republic | 49.9 | |
| Georgia | 49.7 | |
| Malta | 49.5 | |
| Equatorial Guinea | 49.4 | |
| Togo | 49.4 | |
| Botswana | 49.0 | |
| Brunei Darussalam | 48.4 | |
| Malawi | 47.5 | |
| Tanzania | 47.5 | |
| Mauritius | 47.5 | |
| Guyana | 47.1 | |
| Nigeria | 47.0 | |
| Malaysia | 46.6 | |
| Suriname | 46.1 | |
| Belize | 45.9 | |
| Chile | 45.9 | |
| Iran | 45.7 | |
| Samoa | 44.5 | |
| Mexico | 44.3 | |
| Sri Lanka | 42.9 | |
| Cape Verde | 40.1 | |
| Algeria | 39.4 | |
| Syria | 38.8 | |
| Côte d'Ivoire | 38.1 | |
| Guatemala | 36.7 | |
| India | 36.6 | |
| Nicaragua | 36.4 | |
| Lebanon | 36.2 | |
| Swaziland | 35.8 | |
| Turkey | 35.7 | |
| Sao Tome and Principe | 35.2 | |
| Yemen | 34.4 | |
| Pakistan | 34.2 | |
| Bahrain | 34.1 | |
| Jordan | 33.5 | |
| Tunisia | 33.5 | |
| Timor-Leste | 33.5 | |
| United Arab Emirates | 33.4 | |
| Qatar | 32.7 | |
| Morocco | 29.1 | |
| Sudan | 29.0 | |
| Egypt | 25.1 | |
| Oman | 23.5 | |
| Saudi Arabia | 18.8 | |
| West Bank and Gaza | 7.5 |
Education Gap
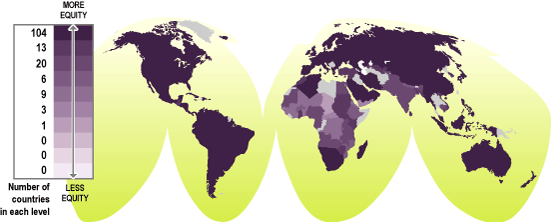
- literacy rate
- primary school enrolment
- secondary school enrolment
- tertiary education enrolment
Warning! Step backwards
The Gender gap in education around the world could be closed very soon. Education is the GEI dimension with the largest number of countries reaching acceptable equity levels. However, alarming situations persist and forty percent of countries experience regression trends, among them many that are already in a very bad situation.
Where are we heading in education? The balance between countries that progress and those that regress is worrisome.
Regressions outnumber progresses by more than two!!
| Education gap_basic data (.rtf) |
Education gap
| Finland | 100.0 | |
| Norway | 100.0 | |
| Germany | 100.0 | |
| Bahamas | 100.0 | |
| Denmark | 100.0 | |
| Barbados | 100.0 | |
| Australia | 100.0 | |
| Philippines | 100.0 | |
| Canada | 100.0 | |
| United States of America | 100.0 | |
| United Kingdom | 100.0 | |
| Uruguay | 100.0 | |
| Slovakia | 100.0 | |
| Belgium | 100.0 | |
| Austria | 100.0 | |
| France | 100.0 | |
| Israel | 100.0 | |
| Poland | 100.0 | |
| Ireland | 100.0 | |
| Brazil | 100.0 | |
| Honduras | 100.0 | |
| Czech Republic | 100.0 | |
| Costa Rica | 100.0 | |
| Dominican Republic | 100.0 | |
| Georgia | 100.0 | |
| Lesotho | 100.0 | |
| Belize | 100.0 | |
| Maldives | 100.0 | |
| Luxembourg | 100.0 | |
| Jamaica | 100.0 | |
| Cuba | 100.0 | |
| Latvia | 100.0 | |
| Colombia | 99.9 | |
| Lithuania | 99.9 | |
| Guyana | 99.9 | |
| New Zealand | 99.9 | |
| Trinidad and Tobago | 99.9 | |
| Botswana | 99.9 | |
| Sweden | 99.9 | |
| Mongolia | 99.9 | |
| Slovenia | 99.9 | |
| Venezuela | 99.9 | |
| Estonia | 99.8 | |
| Russian Federation | 99.8 | |
| Argentina | 99.8 | |
| United Arab Emirates | 99.8 | |
| Ukraine | 99.8 | |
| Lebanon | 99.7 | |
| Kazakhstan | 99.7 | |
| Qatar | 99.7 | |
| Moldova | 99.6 | |
| Italy | 99.6 | |
| Nicaragua | 99.6 | |
| Netherlands | 99.6 | |
| Panama | 99.5 | |
| St Lucia | 99.5 | |
| Hungary | 99.4 | |
| Kyrgyzstan | 99.4 | |
| Romania | 99.3 | |
| Swaziland | 99.2 | |
| Croatia | 99.2 | |
| Spain | 99.1 | |
| Iceland | 99.1 | |
| Cyprus | 99.1 | |
| Belarus | 99.1 | |
| Paraguay | 99.1 | |
| Ecuador | 99.1 | |
| Bulgaria | 99.0 | |
| South Africa | 99.0 | |
| Albania | 99.0 | |
| Greece | 99.0 | |
| Thailand | 98.7 | |
| Suriname | 98.7 | |
| Brunei Darussalam | 98.7 | |
| Bahrain | 98.6 | |
| St Vincent and Grenadines | 98.5 | |
| Hong Kong | 98.5 | |
| Chile | 98.5 | |
| Malta | 98.3 | |
| Macedonia | 98.3 | |
| Malaysia | 98.1 | |
| El Salvador | 98.0 | |
| Portugal | 97.9 | |
| Timor-Leste | 97.9 | |
| Jordan | 97.9 | |
| Mauritius | 97.8 | |
| West Bank and Gaza | 97.8 | |
| Samoa | 97.8 | |
| Mexico | 97.3 | |
| Peru | 96.8 | |
| Saudi Arabia | 96.8 | |
| Azerbaijan | 96.4 | |
| Japan | 96.3 | |
| Oman | 96.0 | |
| Namibia | 96.0 | |
| Sao Tome and Principe | 95.7 | |
| Iran | 95.4 | |
| Bolivia | 95.1 | |
| China | 95.1 | |
| Tunisia | 94.6 | |
| Switzerland | 94.0 | |
| Madagascar | 93.5 | |
| Algeria | 93.3 | |
| Cape Verde | 92.3 | |
| Indonesia | 91.7 | |
| Singapore | 89.6 | |
| Uzbekistan | 89.2 | |
| Viet Nam | 88.6 | |
| Kenya | 87.7 | |
| Guatemala | 86.2 | |
| Zimbabwe | 86.1 | |
| Turkey | 84.4 | |
| Syria | 84.4 | |
| Korea, Rep. | 84.2 | |
| Sri Lanka | 83.7 | |
| Sudan | 82.6 | |
| Bangladesh | 82.3 | |
| Vanuatu | 81.7 | |
| Morocco | 79.8 | |
| Rwanda | 79.7 | |
| Ghana | 79.7 | |
| Tajikistan | 79.2 | |
| Malawi | 78.9 | |
| Gabon | 78.4 | |
| Egypt | 78.3 | |
| India | 77.5 | |
| Cameroon | 76.6 | |
| Cambodia | 76.3 | |
| Senegal | 76.2 | |
| Zambia | 76.2 | |
| Uganda | 75.8 | |
| Tanzania | 75.6 | |
| Angola | 75.4 | |
| Mauritania | 74.1 | |
| Equatorial Guinea | 73.2 | |
| Djibouti | 73.2 | |
| Pakistan | 73.2 | |
| Nigeria | 72.1 | |
| Gambia | 69.2 | |
| Burundi | 68.7 | |
| Mozambique | 66.0 | |
| Burkina Faso | 62.2 | |
| Ethiopia | 61.6 | |
| Nepal | 61.1 | |
| Congo, Rep. | 59.3 | |
| Côte d'Ivoire | 59.2 | |
| Mali | 55.7 | |
| Eritrea | 55.6 | |
| Sierra Leone | 55.0 | |
| Togo | 52.5 | |
| Niger | 52.0 | |
| Benin | 51.1 | |
| Guinea | 51.0 | |
| Guinea-Bissau | 48.2 | |
| Yemen | 46.4 | |
| Central African Republic | 45.6 | |
| Chad | 37.2 |
Empowerment Gap
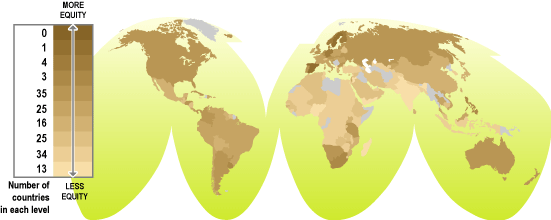
The Empowerment Gap is estimated from the following indicators:
- % of women in technical positions
- % of women in management and government positions
- % of women in parliaments
- % of women in ministerial posts
A large majority of countries rank very low in the empowerment dimension of the GEI. The gap between women and men is highest among professional, managerial, parliamentary and ministerial positions.
This dimension shows the largest gap. However, it is also the only one where a huge majority of countries show progress. Most of the advances registered in the total index happen in countries that have progressed in empowerment.
|
Women members of parliaments globally average only 17 per cent of all seats, far below the goal of 30+ women's representation in national legislatures adopted in Beijing in 1995. Only 19 countries have achieved this figure, considered to be the threshold for women having an on the workings of a parliament. Out of these 19, only 5 (Finland, Denmark, Cuba, New Zealand and Belarus) have made it without legal quotas. Nowadays, there are 97 countries with constitutional, electoral or political party quotas and the average level of representation for women in these countries is 19 per cent. Sources: Global Database of Quotas for Women, IPU database, Wedo. |
| Empowerment gap_ basic data (.rtf) |
Empowerment gap
| Sweden | 83.2 | |
| Finland | 76.1 | |
| Rwanda | 75.4 | |
| Spain | 73.9 | |
| Germany | 72.7 | |
| Norway | 70.9 | |
| Philippines | 65.5 | |
| Netherlands | 62.3 | |
| Denmark | 60.4 | |
| South Africa | 59.7 | |
| Uruguay | 59.7 | |
| Bahamas | 58.9 | |
| Austria | 58.8 | |
| New Zealand | 58.4 | |
| Russian Federation | 58.3 | |
| Barbados | 58.1 | |
| Cuba | 56.8 | |
| Lithuania | 56.7 | |
| Latvia | 56.6 | |
| Colombia | 56.5 | |
| Slovakia | 56.3 | |
| Belgium | 55.9 | |
| Ukraine | 55.7 | |
| Trinidad and Tobago | 55.4 | |
| Iceland | 55.2 | |
| Honduras | 54.2 | |
| Australia | 54.1 | |
| St Lucia | 53.7 | |
| Mongolia | 53.3 | |
| Canada | 53.1 | |
| Panama | 53.0 | |
| Bulgaria | 52.8 | |
| Argentina | 52.8 | |
| Croatia | 52.3 | |
| United States of America | 52.1 | |
| Hong Kong | 51.8 | |
| El Salvador | 51.4 | |
| Tanzania | 51.3 | |
| Estonia | 51.2 | |
| United Kingdom | 51.2 | |
| Moldova | 51.1 | |
| Namibia | 50.8 | |
| Kazakhstan | 50.4 | |
| Macedonia | 50.1 | |
| Portugal | 49.7 | |
| Botswana | 49.5 | |
| Kyrgyzstan | 49.2 | |
| Costa Rica | 49.0 | |
| Ecuador | 49.0 | |
| Singapore | 48.7 | |
| France | 47.9 | |
| Peru | 47.8 | |
| Dominican Republic | 47.1 | |
| Ireland | 46.9 | |
| Paraguay | 46.4 | |
| Belize | 45.8 | |
| Poland | 45.3 | |
| Hungary | 44.7 | |
| Viet Nam | 44.0 | |
| Venezuela | 43.9 | |
| Georgia | 43.5 | |
| Brazil | 43.5 | |
| Czech Republic | 43.4 | |
| Israel | 42.9 | |
| Chile | 42.8 | |
| Slovenia | 42.5 | |
| Romania | 41.9 | |
| Brunei Darussalam | 41.2 | |
| Italy | 40.6 | |
| Thailand | 39.7 | |
| Greece | 39.0 | |
| Cyprus | 38.7 | |
| Mexico | 38.2 | |
| China | 38.2 | |
| Guinea-Bissau | 38.1 | |
| Bolivia | 37.6 | |
| Uganda | 36.5 | |
| Guyana | 34.7 | |
| Lesotho | 34.6 | |
| Mauritius | 34.5 | |
| Mozambique | 34.2 | |
| Timor-Leste | 33.4 | |
| West Bank and Gaza | 33.1 | |
| Sri Lanka | 32.1 | |
| Japan | 30.2 | |
| Malaysia | 29.1 | |
| Syria | 29.0 | |
| Malta | 28.7 | |
| Burundi | 27.9 | |
| Maldives | 27.8 | |
| Senegal | 27.1 | |
| Belarus | 26.1 | |
| Saudi Arabia | 25.7 | |
| Ethiopia | 25.5 | |
| Zambia | 25.2 | |
| Eritrea | 24.8 | |
| Switzerland | 23.9 | |
| Suriname | 23.8 | |
| St Vincent and Grenadines | 23.6 | |
| Luxembourg | 23.5 | |
| Korea, Rep. | 23.5 | |
| Guatemala | 23.5 | |
| Oman | 23.4 | |
| Algeria | 22.4 | |
| Niger | 22.1 | |
| Morocco | 21.4 | |
| Guinea | 21.1 | |
| Cambodia | 21.0 | |
| Cape Verde | 20.6 | |
| Iran | 20.5 | |
| Nicaragua | 19.7 | |
| United Arab Emirates | 19.2 | |
| Zimbabwe | 18.6 | |
| Tunisia | 18.6 | |
| Jamaica | 18.3 | |
| Burkina Faso | 17.7 | |
| Gambia | 17.7 | |
| Bangladesh | 17.6 | |
| Pakistan | 17.5 | |
| Turkey | 17.3 | |
| Mali | 17.0 | |
| Togo | 16.5 | |
| Benin | 16.3 | |
| Malawi | 16.2 | |
| Qatar | 16.2 | |
| Mauritania | 15.9 | |
| Nepal | 15.3 | |
| Egypt | 15.3 | |
| Azerbaijan | 15.2 | |
| Côte d'Ivoire | 15.0 | |
| Sierra Leone | 14.9 | |
| Cameroon | 14.5 | |
| Gabon | 13.8 | |
| Swaziland | 13.7 | |
| Equatorial Guinea | 13.3 | |
| Ghana | 12.8 | |
| Congo, Rep. | 12.6 | |
| Uzbekistan | 12.5 | |
| Indonesia | 12.4 | |
| Sudan | 12.4 | |
| Tajikistan | 12.2 | |
| Angola | 11.8 | |
| Central African Republic | 11.4 | |
| Chad | 10.0 | |
| Kenya | 9.7 | |
| Nigeria | 9.3 | |
| Sao Tome and Principe | 9.3 | |
| Jordan | 8.9 | |
| Djibouti | 8.9 | |
| Madagascar | 7.5 | |
| Samoa | 7.4 | |
| Albania | 6.6 | |
| Vanuatu | 6.5 | |
| India | 6.3 | |
| Yemen | 6.3 | |
| Lebanon | 6.2 | |
| Bahrain | 6.0 |
Evolution of the GEI 2008
| COUNTRY | VARIATION 2008/2004 (%) |
| Malta | 34.9 |
| Iran | 23.7 |
| Ecuador | 22.3 |
| Peru | 21.7 |
| Lesotho | 17.6 |
| Spain | 16.8 |
| Brazil | 16.1 |
| Belize | 15.5 |
| Kazakhstan | 14.7 |
| Paraguay | 14.6 |
| Panama | 14.3 |
| Ireland | 12.8 |
| Algeria | 12.2 |
| Rwanda | 11.9 |
| Colombia | 11.8 |
| Honduras | 11.7 |
| Norway | 11.4 |
| Viet Nam | 11.4 |
| Venezuela | 11.2 |
| Ethiopia | 10.4 |
| Belgium | 10.1 |
| El Salvador | 10.1 |
| Cyprus | 8.0 |
| Croatia | 8.0 |
| Guatemala | 7.8 |
| Netherlands | 7.7 |
| Israel | 7.2 |
| Greece | 7.0 |
| Finland | 6.9 |
| Australia | 6.7 |
| Dominican Republic | 6.5 |
| United Kingdom | 6.4 |
| France | 6.4 |
| Chile | 6.2 |
| Luxembourg | 5.9 |
| Sweden | 5.8 |
| Portugal | 5.6 |
| Italy | 5.4 |
| Bahamas | 5.3 |
| Philippines | 4.9 |
| Iceland | 4.9 |
| Uganda | 4.8 |
| Belarus | 4.8 |
| Burundi | 4.8 |
| Bolivia | 4.6 |
| Suriname | 4.5 |
| West Bank and Gaza | 4.4 |
| Costa Rica | 4.2 |
| Romania | 4.1 |
| Cuba | 4.1 |
| Barbados | 3.6 |
| Guinea | 3.5 |
| Lithuania | 3.4 |
| United Arab Emirates | 3.4 |
| New Zealand | 3.4 |
| Namibia | 3.2 |
| Japan | 2.8 |
| Uruguay | 2.7 |
| Mexico | 2.6 |
| Macedonia | 2.2 |
| Moldova | 2.1 |
| Mongolia | 2.0 |
| Russian Federation | 1.9 |
| Argentina | 1.9 |
| Nepal | 1.8 |
| Yemen | 1.8 |
| Burkina Faso | 1.6 |
| Niger | 1.3 |
| Azerbaijan | 1.3 |
| Ukraine | 1.2 |
| Estonia | 1.2 |
| Hungary | 1.2 |
| Denmark | 1.1 |
| Latvia | 1.1 |
| Cambodia | 1.1 |
| Equatorial Guinea | 1.0 |
| Slovenia | 0.9 |
| Hong Kong | 0.7 |
| Canada | 0.5 |
| Trinidad and Tobago | 0.4 |
| Austria | 0.4 |
| Syria | 0.2 |
| Jordan | 0.2 |
| Thailand | 0.1 |
| Kyrgyzstan | 0.1 |
| Guyana | -0.0 |
| Switzerland | -0.4 |
| Georgia | -0.4 |
| Madagascar | -1.00 |
| Lebanon | -1.2 |
| Mali | -1.2 |
| Zambia | -2.7 |
| United States of America | -2.9 |
| Senegal | -2.9 |
| Chad | -3.1 |
| Korea. Rep. | -3.4 |
| Bahrain | -3.9 |
| Poland | -3.9 |
| Zimbabwe | -3.9 |
| Gabon | -4.7 |
| Bangladesh | -5.2 |
| Sri Lanka | -5.4 |
| Swaziland | -5.7 |
| Botswana | -6.0 |
| Pakistan | -6.3 |
| Czech Republic | -6.7 |
| Kenya | -7.1 |
| Slovakia | -7.4 |
| Ghana | -7.4 |
| Malaysia | -7.9 |
| Togo | -7.9 |
| Tunisia | -7.9 |
| Indonesia | -8.9 |
| Tajikistan | -8.9 |
| Albania | -9.1 |
| Côte d'Ivoire | -9.7 |
| Cape Verde | -9.7 |
| Congo. Rep. | -9.7 |
| Turkey | -10.6 |
| Jamaica | -11.8 |
| Central African Republic | -11.9 |
| Maldives | -12.1 |
| Sierra Leone | -13.9 |
| Sudan | -14.7 |
| Egypt | -15.2 |
| Nicaragua | -15.5 |
| Angola | -16.2 |
| Morocco | -16.5 |
| Malawi | -17.7 |
| Uzbekistan | -18.8 |
| Gambia | -19.00 |
| Benin | -26.8 |
| Eritrea | -27.8 |
| Brunei Darussalam | ND |
| Bulgaria | ND |
| Cameroon | ND |
| China | ND |
| Djibouti | ND |
| Guinea-Bissau | ND |
| India | ND |
| Mauritania | ND |
| Mauritius | ND |
| Mozambique | ND |
| Nigeria | ND |
| Oman | ND |
| Qatar | ND |
| Samoa | ND |
| Sao Tome and Principe | ND |
| Saudi Arabia | ND |
| Singapore | ND |
| South Africa | ND |
| St Lucia | ND |
| St Vincent and Grenadines | ND |
| Tanzania | ND |
| Timor-Leste | ND |
| Vanuatu | ND |
GEI values in 2008
The three dimensions included in the GEI are: economic activity, empowerment and education. 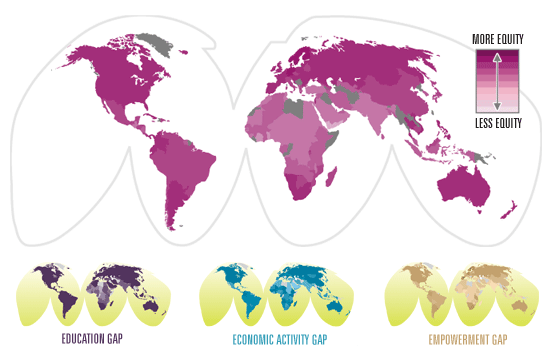
|
COUNTRY |
EDUCATION |
ECO. ACT |
EMPOW. |
GEI 2008 |
|
| Sweden |
99.9
|
83.8
|
83.2
|
89
|
|
| Finland | 100.0 | 78.5 | 76.1 | 85 | |
| Norway | 100.0 | 81.9 | 70.9 | 84 | |
| Germany | 100.0 | 67.6 | 72.7 | 80 | |
| Rwanda | 79.7 | 84.5 | 75.4 | 80 | |
| Bahamas | 100.0 | 80.7 | 58.9 | 80 | |
| Denmark | 100.0 | 78.6 | 60.4 | 80 | |
| New Zealand | 99.9 | 76.1 | 58.4 | 78 | |
| Iceland | 99.1 | 78.8 | 55.2 | 78 | |
| Netherlands | 99.6 | 70.7 | 62.3 | 78 | |
| Lithuania | 99.9 | 75.6 | 56.7 | 77 | |
| Spain | 99.1 | 58.2 | 73.9 | 77 | |
| Barbados | 100.0 | 73.2 | 58.1 | 77 | |
| Russian Federation | 99.8 | 71.2 | 58.3 | 76 | |
| Australia | 100.0 | 75.2 | 54.1 | 76 | |
| Philippines | 100.0 | 63.5 | 65.5 | 76 | |
| Latvia | 100.0 | 71.0 | 56.6 | 76 | |
| Canada | 100.0 | 73.8 | 53.1 | 76 | |
| Colombia | 99.9 | 69.7 | 56.5 | 75 | |
| Kazakhstan | 99.7 | 75.1 | 50.4 | 75 | |
| United States of America | 100.0 | 72.3 | 52.1 | 75 | |
| United Kingdom | 100.0 | 72.8 | 51.2 | 75 | |
| Uruguay | 100.0 | 63.9 | 59.7 | 75 | |
| Slovakia | 100.0 | 67.1 | 56.3 | 74 | |
| Bulgaria | 99.0 | 71.6 | 52.8 | 74 | |
| Moldova | 99.6 | 71.8 | 51.1 | 74 | |
| Ukraine | 99.8 | 66.9 | 55.7 | 74 | |
| Estonia | 99.8 | 71.2 | 51.2 | 74 | |
| Croatia | 99.2 | 70.7 | 52.3 | 74 | |
| Belgium | 100.0 | 64.2 | 55.9 | 73 | |
| Austria | 100.0 | 61.0 | 58.8 | 73 | |
| France | 100.0 | 71.7 | 47.9 | 73 | |
| Israel | 100.0 | 75.2 | 42.9 | 73 | |
| Portugal | 97.9 | 69.0 | 49.7 | 72 | |
| Hong Kong | 98.5 | 66.0 | 51.8 | 72 | |
| Romania | 99.3 | 74.6 | 41.9 | 72 | |
| Argentina | 99.8 | 61.9 | 52.8 | 72 | |
| Kyrgyzstan | 99.4 | 65.8 | 49.2 | 71 | |
| Poland | 100.0 | 68.8 | 45.3 | 71 | |
| Viet Nam | 88.6 | 81.2 | 44.0 | 71 | |
| Panama | 99.5 | 60.7 | 53.0 | 71 | |
| Slovenia | 99.9 | 70.6 | 42.5 | 71 | |
| Ecuador | 99.1 | 64.3 | 49.0 | 71 | |
| Hungary | 99.4 | 68.3 | 44.7 | 71 | |
| Namibia | 96.0 | 65.6 | 50.8 | 71 | |
| St Lucia | 99.5 | 59.1 | 53.7 | 71 | |
| Mongolia | 99.9 | 58.2 | 53.3 | 70 | |
| Ireland | 100.0 | 63.3 | 46.9 | 70 | |
| South Africa | 99.0 | 51.4 | 59.7 | 70 | |
| Thailand | 98.7 | 71.7 | 39.7 | 70 | |
| Trinidad and Tobago | 99.9 | 53.7 | 55.4 | 70 | |
| Cuba | 100.0 | 52.0 | 56.8 | 70 | |
| Brazil | 100.0 | 64.6 | 43.5 | 69 | |
| Peru | 96.8 | 63.4 | 47.8 | 69 | |
| Honduras | 100.0 | 53.6 | 54.2 | 69 | |
| Czech Republic | 100.0 | 64.0 | 43.4 | 69 | |
| China | 95.1 | 73.3 | 38.2 | 69 | |
| Cyprus | 99.1 | 68.2 | 38.7 | 69 | |
| Venezuela | 99.9 | 60.8 | 43.9 | 68 | |
| Macedonia | 98.3 | 55.5 | 50.1 | 68 | |
| Costa Rica | 100.0 | 54.3 | 49.0 | 68 | |
| Paraguay | 99.1 | 55.6 | 46.4 | 67 | |
| El Salvador | 98.0 | 51.2 | 51.4 | 67 | |
| Greece | 99.0 | 61.2 | 39.0 | 66 | |
| Bolivia | 95.1 | 65.7 | 37.6 | 66 | |
| Botswana | 99.9 | 49.0 | 49.5 | 66 | |
| Belarus | 99.1 | 72.7 | 26.1 | 66 | |
| Dominican Republic | 100.0 | 49.9 | 47.1 | 66 | |
| Singapore | 89.6 | 58.6 | 48.7 | 66 | |
| Italy | 99.6 | 54.6 | 40.6 | 65 | |
| Uganda | 75.8 | 81.1 | 36.5 | 64 | |
| Georgia | 100.0 | 49.7 | 43.5 | 64 | |
| Lesotho | 100.0 | 57.6 | 34.6 | 64 | |
| Belize | 100.0 | 45.9 | 45.8 | 64 | |
| Mozambique | 66.0 | 91.5 | 34.2 | 64 | |
| Switzerland | 94.0 | 71.3 | 23.9 | 63 | |
| Brunei Darussalam | 98.7 | 48.4 | 41.2 | 63 | |
| Chile | 98.5 | 45.9 | 42.8 | 62 | |
| Maldives | 100.0 | 58.6 | 27.8 | 62 | |
| Azerbaijan | 96.4 | 73.3 | 15.2 | 62 | |
| Burundi | 68.7 | 88.1 | 27.9 | 62 | |
| Luxembourg | 100.0 | 60.1 | 23.5 | 61 | |
| Jamaica | 100.0 | 64.7 | 18.3 | 61 | |
| Japan | 96.3 | 55.3 | 30.2 | 61 | |
| Madagascar | 93.5 | 80.8 | 7.5 | 61 | |
| Guyana | 99.9 | 47.1 | 34.7 | 61 | |
| St Vincent and Grenadines | 98.5 | 59.5 | 23.6 | 61 | |
| Cambodia | 76.3 | 83.5 | 21.0 | 60 | |
| Mauritius | 97.8 | 47.5 | 34.5 | 60 | |
| Mexico | 97.3 | 44.3 | 38.2 | 60 | |
| Kenya | 87.7 | 80.6 | 9.7 | 59 | |
| Malta | 98.3 | 49.5 | 28.7 | 59 | |
| Ghana | 79.7 | 82.5 | 12.8 | 58 | |
| Tanzania | 75.6 | 47.5 | 51.3 | 58 | |
| Malaysia | 98.1 | 46.6 | 29.1 | 58 | |
| Zimbabwe | 86.1 | 67.0 | 18.6 | 57 | |
| Uzbekistan | 89.2 | 68.9 | 12.5 | 57 | |
| Suriname | 98.7 | 46.1 | 23.8 | 56 | |
| Vanuatu | 81.7 | 79.5 | 6.5 | 56 | |
| Albania | 99.0 | 61.9 | 6.6 | 56 | |
| Zambia | 76.2 | 64.0 | 25.2 | 55 | |
| Timor-Leste | 97.9 | 33.5 | 33.4 | 55 | |
| Senegal | 76.2 | 61.3 | 27.1 | 55 | |
| Korea. Rep. | 84.2 | 53.9 | 23.5 | 54 | |
| Iran | 95.4 | 45.7 | 20.5 | 54 | |
| Sri Lanka | 83.7 | 42.9 | 32.1 | 53 | |
| Angola | 75.4 | 71.3 | 11.8 | 53 | |
| Gabon | 78.4 | 65.9 | 13.8 | 53 | |
| Tajikistan | 79.2 | 65.8 | 12.2 | 52 | |
| Indonesia | 91.7 | 52.8 | 12.4 | 52 | |
| Ethiopia | 61.6 | 69.7 | 25.5 | 52 | |
| Burkina Faso | 62.2 | 76.6 | 17.7 | 52 | |
| Nicaragua | 99.6 | 36.4 | 19.7 | 52 | |
| Algeria | 93.3 | 39.4 | 22.4 | 52 | |
| Bangladesh | 82.3 | 53.5 | 17.6 | 51 | |
| Cape Verde | 92.3 | 40.1 | 20.6 | 51 | |
| United Arab Emirates | 99.8 | 33.4 | 19.2 | 51 | |
| Syria | 84.4 | 38.8 | 29.0 | 51 | |
| Guinea | 51.0 | 79.8 | 21.1 | 51 | |
| Mali | 55.7 | 77.3 | 17.0 | 50 | |
| Samoa | 97.8 | 44.5 | 7.4 | 50 | |
| Swaziland | 99.2 | 35.8 | 13.7 | 50 | |
| Qatar | 99.7 | 32.7 | 16.2 | 50 | |
| Cameroon | 76.6 | 57.1 | 14.5 | 49 | |
| Gambia | 69.2 | 60.8 | 17.7 | 49 | |
| Mauritania | 74.1 | 57.3 | 15.9 | 49 | |
| Tunisia | 94.6 | 33.5 | 18.6 | 49 | |
| Guatemala | 86.2 | 36.7 | 23.5 | 49 | |
| Guinea-Bissau | 48.2 | 58.3 | 38.1 | 48 | |
| Oman | 96.0 | 23.5 | 23.4 | 48 | |
| Malawi | 78.9 | 47.5 | 16.2 | 48 | |
| Lebanon | 99.7 | 36.2 | 6.2 | 47 | |
| Saudi Arabia | 96.8 | 18.8 | 25.7 | 47 | |
| Jordan | 97.9 | 33.5 | 8.9 | 47 | |
| Sao Tome and Principe | 95.7 | 35.2 | 9.3 | 47 | |
| Niger | 52.0 | 65.8 | 22.1 | 47 | |
| Bahrain | 98.6 | 34.1 | 6.0 | 46 | |
| West Bank and Gaza | 97.8 | 7.5 | 33.1 | 46 | |
| Djibouti | 73.2 | 56.2 | 8.9 | 46 | |
| Turkey | 84.4 | 35.7 | 17.3 | 46 | |
| Equatorial Guinea | 73.2 | 49.4 | 13.3 | 45 | |
| Eritrea | 55.6 | 54.3 | 24.8 | 45 | |
| Nepal | 61.1 | 57.0 | 15.3 | 44 | |
| Morocco | 79.8 | 29.1 | 21.4 | 43 | |
| Congo. Rep. | 59.3 | 57.4 | 12.6 | 43 | |
| Nigeria | 72.1 | 47.0 | 9.3 | 43 | |
| Central African Republic | 45.6 | 70.0 | 11.4 | 42 | |
| Pakistan | 73.2 | 34.2 | 17.5 | 42 | |
| Sudan | 82.6 | 29.0 | 12.4 | 41 | |
| Sierra Leone | 55.0 | 52.8 | 14.9 | 41 | |
| Benin | 51.1 | 54.7 | 16.3 | 41 | |
| Chad | 37.2 | 74.9 | 10.0 | 41 | |
| India | 77.5 | 36.6 | 6.3 | 40 | |
| Egypt | 78.3 | 25.1 | 15.3 | 40 | |
| Togo | 52.5 | 49.4 | 16.5 | 39 | |
| Côte d'Ivoire | 59.2 | 38.1 | 15.0 | 37 | |
| Yemen | 46.4 | 34.4 | 6.3 | 29 |
| Attachment | Size |
|---|---|
| SW-GEI-2008.pdf | 181.29 KB |
GENDER EQUITY INDEX 2008 - FLASH VERSION
ITALIAN VERSION OF THE GENDER EQUITY INDEX 2008 (pdf)
| Attachment | Size |
|---|---|
| 2008-SW-Italy-GEI.pdf | 1.13 MB |
Money and equity do not go hand in hand
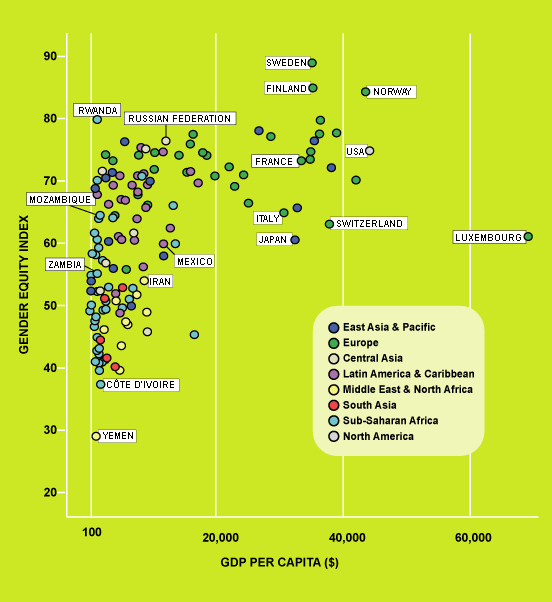
While bridging the gender gap with scarce resources is no easy task, the GEI shows that income is not the sole factor explaining equity or the lack of it. Countries with very high per capita incomes, such as Luxembourg or Switzerland, have the same equity level as Mozambique, whose income level is ostensibly lower. On the other hand, countries such as Rwanda, Zambia or Côte d'Ivoire, with similar incomes, show distinct differences in their gender equity rankings. A high income level is not a guarantee for gender equity and a low one is no reason to justify a big gap between men and women.
Recent evolution of the GEI components
Number of countries progressing and regressing
SW Gender Equity Index 2008
Gender equity has many dimensions and it is not easy to measure, due to the lack of accurate, gender discriminated social indicators in many countries. In order to contribute to the understanding of gender-based inequities and to monitor the status and its evolution, Social Watch has developed the Gender Equity Index (GEI). This index is based on internationally available comparable data and it makes it possible to position and classify countries according to a selection of indicators relevant to gender inequity in three different dimensions: education, participation in the economy and empowerment.
In 2008, the GEI ranks the present situation of 157 countries, based on the most recent statistics available, and is able to determine evolution trends in 133 by comparing their present index with that of five years ago. (See the detailed methodology references and complete listings)
The index has a maximum possible value of 100%, which would indicate no gender gap at all in each of the three dimensions. The GEI measures the gap between women and men, not their welfare. Thus, for example, a country where both boys and girls have equal access to university studies would rank 100 in this aspect, and a country where both boys and girls are equally unable to complete primary school would also rank 100. This is not to imply that the quality of the education should not be improved. It just says that boys and girls suffer from the same lack of quality.
Education is the only component in the index where many countries have actually reached parity level. When parity is achieved no further progress is possible. But beyond the fact that many countries do not progress, the GEI education component reveals that too many of them are regressing.
In the two other dimensions, related to women's integration into economic and political life, no country shows complete parity yet.
The GEI evidences that income differences between countries are no justification for gender-based inequities. Many poor countries have achieved high level of equity, which is a positive achievement, even when that means an equitable distribution of poverty. In fact, the reverse is often true: many countries that have acceptable average figures in social indicators frequently hide behind those averages enormous disparities between men and women. The elimination of gender disparities can be achieved with active policies and does not require that countries improve their income levels in order to succeed (see section Money and equity do not go hand in hand).
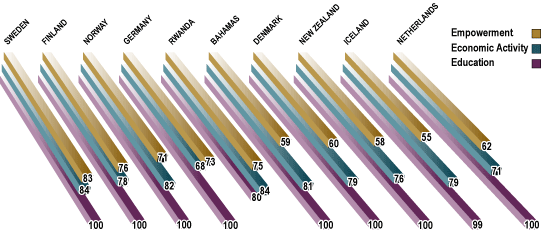
Sweden, Finland and Norway continue to have the highest rankings in the 2008 GEI. Although the three countries do not lead in all the dimensions that make up the index (see gaps in Education, Empowerment and Economic Activity) they have good performances in all of them. Germany ranks forth and Rwanda -- one of the poorest countries in the world - takes the fifth place. In all these cases, the gender gap has been reduced through active policies, including gender quotas for political participation in elected bodies and pro-equity regulations in the labour market.
TECHNICAL NOTES
THE CONSTRUCTION OF THE GEI
1. Dimensions and indicators
• Empowerment (% of women in technical positions, % of women in management and government positions, % of women in parliaments, % of women in ministerial posts).
• Economic activity (income gap, activity rate gap).
• Education (literacy rate gap, primary school enrolment rate gap, secondary school enrolment rate gap, tertiary educa tion enrolment rate gap).
2. Gaps
To construct the gaps in those indicators not presented as such in the original sources, the following operation was carried out. In the first place, percentages for men were calculated by difference with those for women:
- % of men in technical positions,
- % of men in management and government positions,
- % of men in parliaments,
- % of men in ministerial posts.
Secondly, for each country the weight of the female population in relation to male population was
calculated for the relevant age ranges (over 19 years old, except for the economically ac tive population indicator, for which over 14 years old was used).
Weight of female population = % of female population / % of male population
The gap was calculated for each indicator for each country, with the rate for women as the numerator and the rate for men as the denominator, weighted by the inverse of the weight of the female population.(1)
% female rate * (weight of female popula tion)-1 / % male rate
3. Construction of the components for each dimension of the index
For each dimension the average of the indicators of the gaps was calculated, but no values were assigned for those countries lacking available information for half the indicators of the dimension.
4. Construction of the index
The index was calculated as an average of the values obtained in the three dimensions (the average of the gaps in each dimension).
(1) The value 0 was re-codified as 0.01 to allow algebraic calculations. At the other end of the scale, values greater than 1 were re-codified as 1, since this is the normative limit proposed in accordance to the purposes of the index.
The Best
The Worst
The stairway to gender equity
BIG STEPS AHEAD
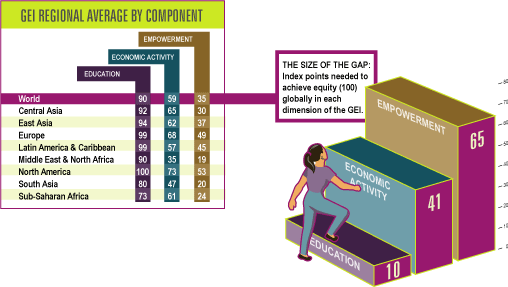
The step leading to gender equity in education in all countries of the world is not a very big one. Yet, more countries are regressing in education than those making progresses. A larger number of countries show significant progress in economic activity, but the number of those regressing is also considerable and the global trend is therefore unclear. Evolution in empowerment seems promissing, since most countries are showing progress, yet this is by far the largest gap to overcome.

