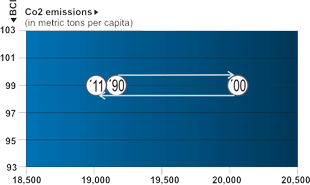
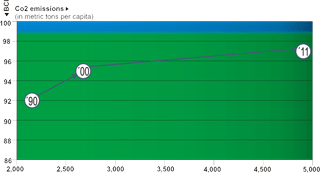
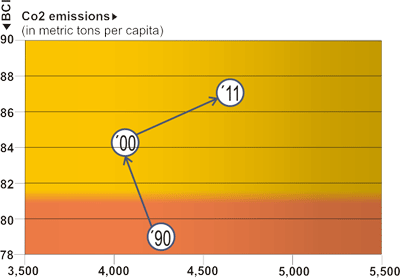
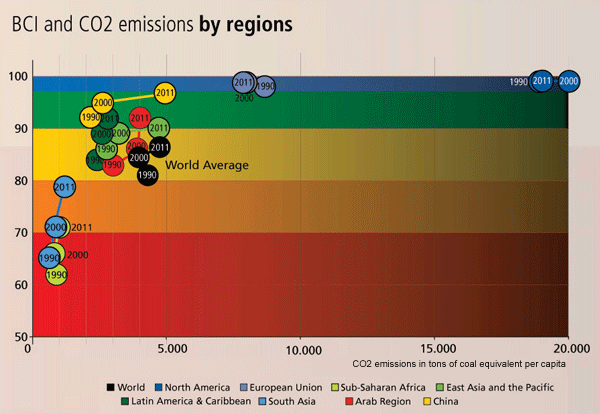
BCI and Co2 emissions by region
Social Progress and Environmental Damage
The Basic Capabilities Index and CO2 emissions
Sub-Saharan Africa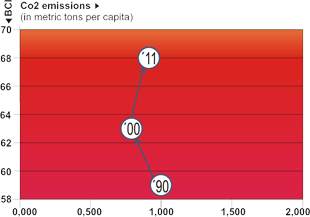 |
Latin America and the Caribbean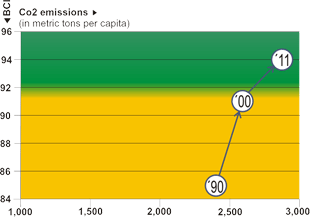 |
|
Arab countries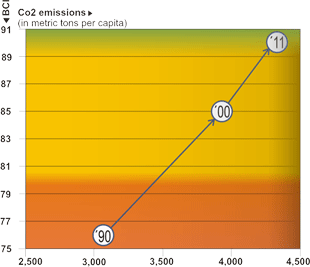 |
European Union
|
|
| East Asia and the Pacific
|
South Asia
|
|
| North America
|
China
|
|
| World
|
||
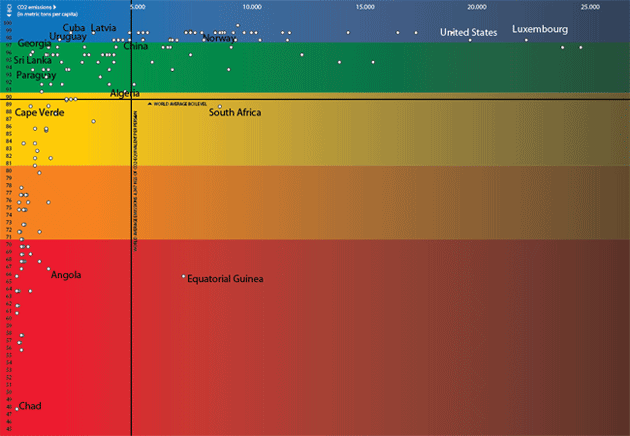
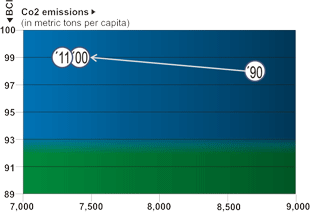
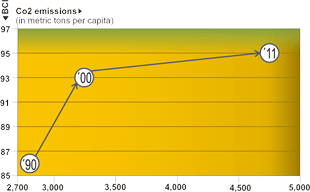
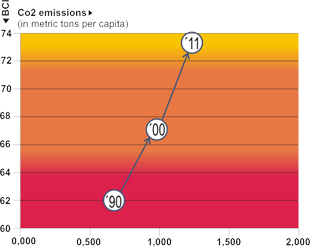
The vertical axis shows the situation in the BCI (infant mortality, primary education, attended births), which has a maximum value of 100. The horizontal axis shows per capita emissions of Co2 in tons of coal equivalent |
||
