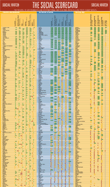
THE SOCIAL WATCH 2003 SCORECARD
Published on Wed, 2010-07-14 12:12
 THE RECORD OF GOVERNMENTS AND INTERNATIONAL INSTITUTIONS IN FULFILLING THEIR COMMITMENTS The indicators used to produce the tables «Progress and Regression» and «The Present Situation» are grouped in seven areas, each of which combine more than one variable: «Illiteracy» (adult illiteracy rates and illiteracy among 15-24 year olds); «Reproductive health» (percentage of pregnancies and deliveries attended by skilled personnel); «Food» (daily per capita calorie intake and percentage of under-5 children suffering from malnutrition); «Services» (percentage of population with access to sanitation, percentage of population with access to improved water sources and telephone lines per 1,000 inhabitants); «Childhood» (infant mortality rate, under-5 mortality rate, percentage of children reaching 5th grade and net primary school enrolment rate); and «Gender» (female to male ratio with respect to unemployment, gross enrolment rate in primary school and illiteracy among 15-24 year-olds). The table «Progress and Regression» shows progress, stagnation and regression with respect to the internationally agreed social development goals. Progress and regression have been calculated in linear terms on the basis of changes produced since 1990 and the most recent data with respect to key indicators for selected commitments. Each variable was categorised on a scale ranging from significant progress to significant regression, taking into account the distribution of the annual growth rates registered between 1990 and the latest available data. A second table, «The Present Situation» shows the current status of social development in each country with regard to the same series of chosen indicators based on the most recent data available. In other words, it shows how near or far countries are on average from achieving their targets, without indicating whether they are progressing towards them or not. The countries’ ranking was calculated by taking into account the distribution of values for each variable and converting them into four categories: 1) close to or beyond targets; 2) above average; 3) below average; 4) critical situation. The table «Progress and Regression» therefore reflects the rate of progress, while the table «The Present Situation» provides a «snapshot» of countries’ current situation. The two tables are designed to complement each other. A small advance in a country with a high level of social development is not the same as a small advance in a country that still has a long way to go. A third table «Political will» reflects the current position of countries on issues directly linked to governmental decisions expressed in the priority given to social spending, defence spending, ODA, and ratification of fundamental international conventions. The criterion for listing the countries in these tables responds to three basic simultaneous features: the value of the average status or progress in all areas; the quantity of areas for which the country has information; the alphabetical order of the country’s name. In the table «The Present Situation» different colour shadings show countries with equal average values. Comments on these figures, the methodology followed in building these rankings, the countries’ statistical charts and further analysis by civil society organisations from each country about the quality of social policies, political will and alternatives are published in Social Watch 2003 The Poor and the Market.
Tags: » |
SUSCRIBE TO OUR NEWSLETTER


